New Feature Added: Dividend History of Dow Jones Index Constituents

One of the new features that I have added on this site is the Dividend History of Stocks. Currently the dividend history of all the components of the Dow are posted. More dividend history pages of other companies will be added regularly.

You can check out the dividend history pages by clicking on the Dividend history link on each component here:

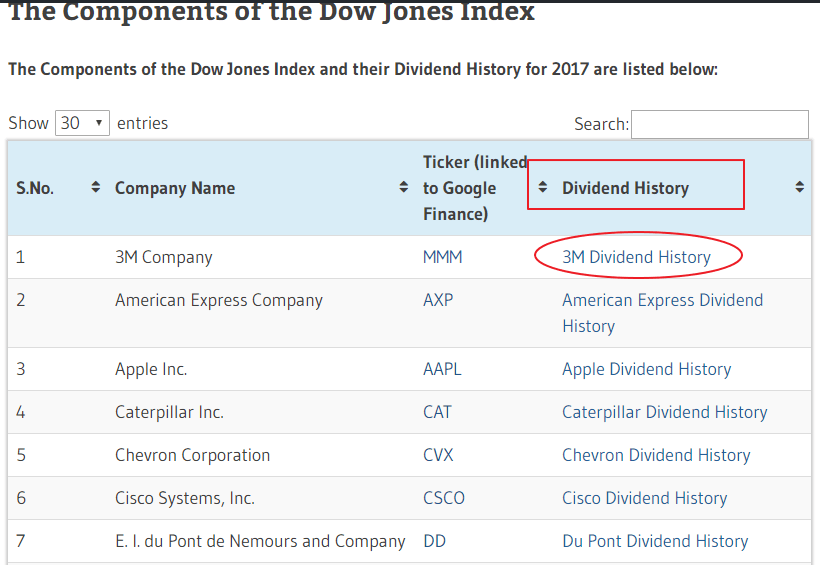
Click on above image to go the dividend history pages.

Dividend History page links for a few components are listed below:

Disclosure: No Positions


Tech Firms Dominate The World’s Top Companies By Market Value

Silicon Valley tech companies dominate the list of the world’s top eight companies by market capitalization. The five tech firms in the list are: Apple(AAPL), Alphabet(GOOG), Microsoft (MSFT), Amazon (AMZN) and Facebook(FB). Old-world giants like Exxon Mobile(XOM) and Johnson & Johnson(JNJ) have lower market caps than the tech titans.

Click to enlarge

Source: Silicon Valley behemoths raise monopoly concerns, Livemint, May 1, 2017

Disclosure: No Positions

Corporate Tax Rates in Select Developed Countries: Chart

The US corporate tax rate has stayed at the 40% rate for many years now. But in many developed countries the tax rate has been been declining in the past few years as shown in the chart below:

Click to tn enlarge


Source: Charles Schwab, KPMG data as of 4/26/2017.

The U.S. statutory corporate income tax rate is approximately 40%. While the marginal federal corporate income tax rate on the highest income bracket of corporations is 35%, state and local governments also impose income taxes averaging approximately 7.5%. Since corporations may deduct its state and local income tax expense when computing its federal taxable income, this generally results in a net effective rate of approximately 40%.Corporate tax rate displayed is the combination of federal and local taxes and surcharges in each country to allow for accurate comparisons across borders.

Source: What the Coming Tax Cuts Mean for the Stock Market, Schwab

Should You Hold Emerging Market Stocks For The Long-Term ?

Emerging market equities can offer substantially higher returns than developed equities due to many reasons. For instance, the economies of developing countries grow much higher and faster than developed countries.While firms in the developed world may struggle to grow their market share in the domestic market companies in the emerging world may continue to expand as the growth potential is huge. Products like consumer goods, healthcare items, household goods, food products, etc. have yet to reach many consumers in the developing world unlike in the developed world where people take these things for granted.

From an investment point of view, many investors own emerging market stocks for their price appreciation potential. This makes sense since they are basically trying t profit from the higher economic growth common in these markets. Not many investors go to emerging markets for safety, higher dividend yield, etc. Compared to the developed markets, emerging market equities are more risky in general and they are also more volatile. Many emerging markets are more volatile because of many factors including low retail and domestic investor participation, political risk, currency risk, state intervention in industries, etc. While political risk is rarely an issue in the developed countries, in emerging markets it is a huge risk.

So one of the questions that emerging market investors may have is this: Should I hold my emerging stocks for the long-term as measured by years  and decades?  This is a valid question since emerging economies tend to have uneven growth. Periods of strong economic expansions are followed by severe contractions and the cycle repeats. Due to this roller-coaster ride, investors may wonder if it is a good idea to sell emerging stocks at the peak and then buy back at the trough and then sell again at the next peak and perform these actions over and over again. To put it another way: Can market timing work in emerging markets?

Though developing economies experience for boom and busts, research suggests that investors are better off holding emerging stocks for the long-term as opposed to engaging in market timing, Despite the ups-and-downs of emerging markets, higher returns are possible when investors stay put even during market volatility. This makes sense since one invests in these markets to capture the profits from higher economic growth over the years and not in weeks or months. Hence pulling out of emerging stocks during market crashes is not a wise strategy.

From a Morgan Stanley research report on this topic:

Trying to get the timing right in a volatile asset class like this is nearly impossible,” he says. Instead, investors comfortable with the higher risks of emerging markets versus developed markets, should consider strategies that seek to generate more consistent returns, while staying invested during the asset class’s ups and downs.

“Investors have to stop thinking about EM in terms of piling in when it’s rallying and rushing out again when things go bad,” Sinha argues.

His team’s analysis of MSCI EM index returns since 1988 suggests that a $10,000 investment made back then would now be valued at about $80,000. On the other hand, investors who hopped in and out of the market wouldn’t have seen anywhere near that return for the same time period.

Sinha is not suggesting that EM stocks need to be held for 28 years. Rather, the analysis of the index’s returns over time demonstrates that even missing out on upside a few months every year can defeat the purpose of buying EM stocks for return potential.

Source: Emerging Markets: It;s How, Not When, Morgan Stanley

To check the importance of holding emerging equities for the long-term, I tested the returns of three randomly-selected stocks. Below are the returns of these stocks over different time periods.

1.Banco de Chile (BCH)

YTD Return: 4%

5-Year Return: -21%

10-Year Return: 46%

Long-Term Return: 297%

2.ICICI Bank Ltd (IBN)

YTD Return: 14%

5-Year Return: 29%

10-Year Return: -4%

Long-Term Return: 193%

3. Itau Unibanco Holding SA (ITUB)

YTD Return: 20%

5-Year Return: -14%

10-Year Return: -86%

Long-Term Return: 14%

Until late last year, Chile was hurt deeply by the collapse in copper prices. So the five year return is negative for BCH. But over the 10-year and long-term the returns are positive and decent. Though the stock has seen its share of volatility over the years, it would be unwise to sell and buy back at a lower price. It should be noted that the bank pays solid dividends and those are not included in the above returns. So if the dividends received are included the returns would be much higher. This example proves that holding emerging stocks for the long-term is not a bad idea. Similarly the Indian equity market has experienced bull and bear markets over the past few decades. In the 5-year period IBN yielded a 29% return. But over the year 10-year period the return was a loss of 4%. However since April 2000 the stock has had a return of 193%.

In summary, investors can hold emerging stocks for the long-run provided they are high-quality stocks. Holding an internet dot-com stock from China or a small-cap gold miner in South Africa for the long-term is foolish. Instead just like developed markets, investors need to identify good companies in emerging markets and can hold them for years ignoring short-term volatility that seem to hallmark of these markets.

Note: Returns shown above are price returns only (excluding dividends)

Data Source: Google Finance

Disclosure: Long BCH and ITUB

Dividends: How Much Do They Contribute to Total Returns ?

Dividends form an important source of return when calculating the overall total return of an equity investment. While price appreciation is not guaranteed dividends can continue to paid out by firms. Though dividends can be suspended or cut, mature high-quality companies large-cap companies do not take such actions other than in extreme circumstances. For investors looking to each a higher total return over the long run, it is important that they reinvest the dividends received instead of spending them. Compounding of reinvested dividends over many years can boost returns further.

Dividends are very important even in a low dividend-paying market like the US. This is because dividends can act as a cushion during down market and yield higher overall returns and the compounding effect over the long-term. According to an article by Matthew A. Young of Richard C. Young & Co dividends accounted for about 54% of the US stock market returns since the 1940s. The following chart shows the dividend contribution to returns on the S&P by decades:

Click to enlarge

Source: Client Letter – February 2017, Richard C. Young & Co

An excerpt from the piece:

Dividends can play an especially important role when valuations are elevated (as we would argue is the case today) and appreciation potential is limited. In the first 15 years of this century, the ultra-low dividend-paying Nasdaq Composite Index didn’t gain a single point. However, an investment in high-dividend-paying stocks compounded investors’ money at 7% per year. And during the 16 years from 1965 to 1981 when the Dow delivered nothing in the way of capital gains, high-dividend-yielding stocks gained 8.1% annually.

The importance of dividends cannot be overstated. While much of the media focus on the S&P Price Index, the correct index to pay attention to for most retail investors is the S&P 500 Total Return Index which includes returns with dividends reinvested. The following chart from a recent Fidelity article shows the huge gap in returns between the S&P 500 Index and the  S&P 500 Total Return Index.

Click to enlarge

Source: Dividends: not just for income, Fidelity

From the article:

Consider this example: between 1997 and 2017, the price of the S&P 500® index was up about 190%, but if you look at the S&P 500 Total Return Index, which includes the reinvestment of dividends and other distributions, the index increased by 321%. That shows the power of reinvesting dividends over time. It works out to a compound annual growth rate of 7.45% compared to 5.47% for the price-only index.

Also checkout:

Related ETF:

  • SPDR S&P 500 ETF (SPY)
  • SPDR S&P Dividend ETF (SDY)
  • Vanguard Dividend Appreciation ETF (VIG)

Disclosure: No Positions