Comparing Military Power of Select East Asian Countries

The graphic below shows the military power of China, North Korea, South Korea and Japan. North Korea has a population of 24 million and an active military force of about 1.2 million.  China which has a population of over 1.3 billion has just 2.2 million active military personnel. North Korea has a strong military since the country focuses on defense then civilian economy. As a result, its military is strong but perennially has economic woes and civilians suffer even to access basic necessities such as food.  On the other hand, in a perverse sense its strong military also ensures hostilities do not break out shattering the fragile peace now holding in the region for many decades.

Click to enlarge

Source: North Korea crisis: Which country has the strongest military in the region?, Deutsche Welle
Monthly Real S&P 500 Price from 1881 thru March 2017: Chart

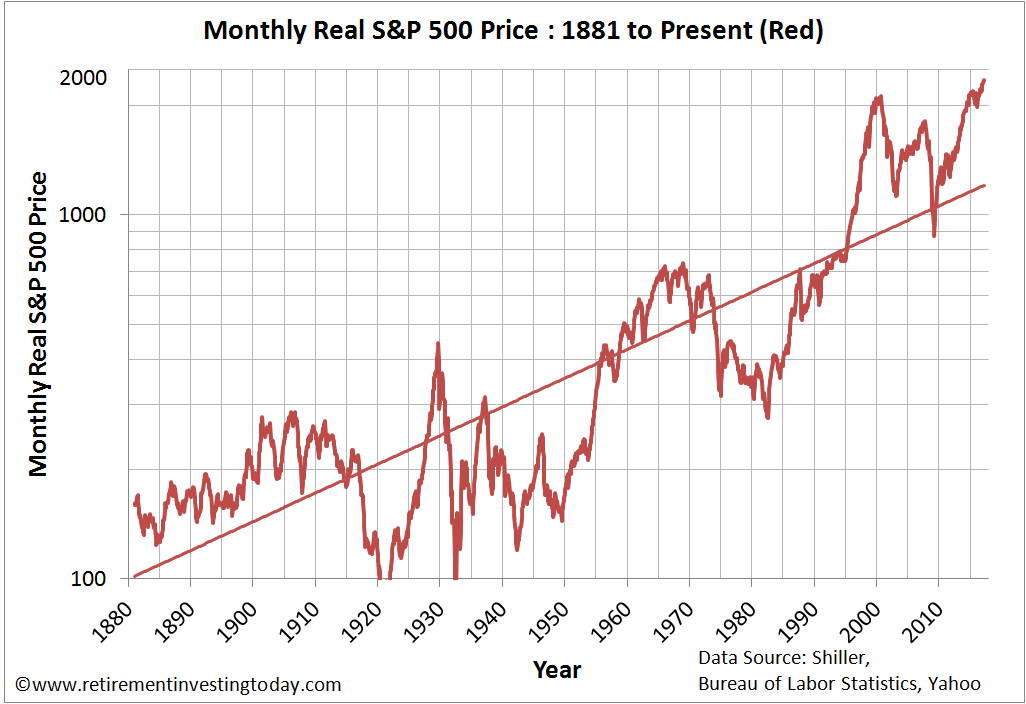
The S&P 500 closed at 2,402.32 on price basis today. Year-to-date the index is up a decent 7.30%. In the past 10 years it has grown by 4.81%. Over the long run the index has beat inflation. The Monthly Real Return of S&P 500 from 1881 thru March, 2017 is shown below:

Click to enlarge


Source: Keep calm and carry on, Retirement Investing Today

Though it is very rare for investors to hold stocks over 100 years,  the above chart shows that in the long-run the US market as measured by the benchmark S&P 500 goes higher.

Related ETF:

  • SPDR S&P 500 ETF (SPY)

Disclosure: No Positions

Number of US Stocks vs. Indices: Chart

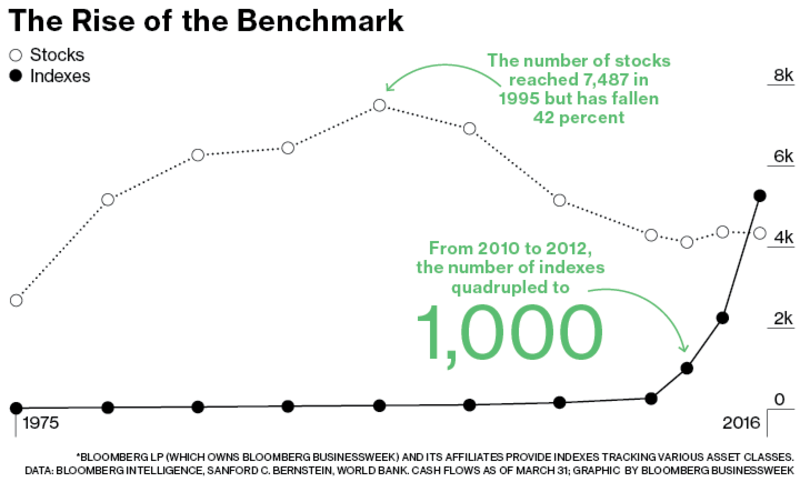
The number of stocks listed on US markets continue to decline. However the number of indices created based on US stocks has soared and now excess the number of stocks according to an article at Bloomberg.

Click to enlarge

Source:

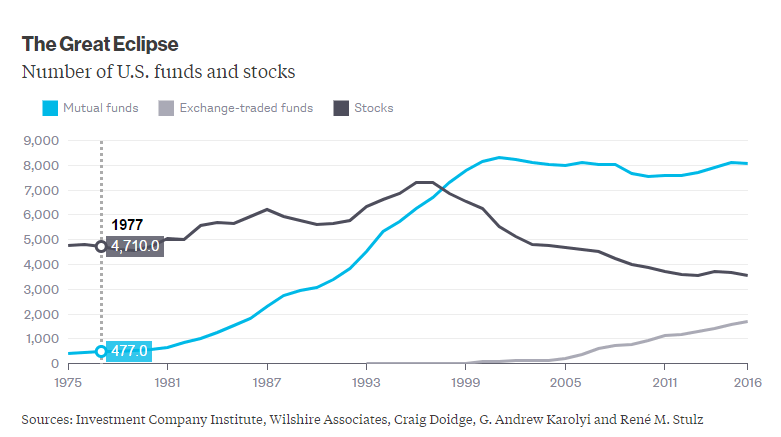
This situation is similar to the one related to the number of US stocks and mutual funds. A few years ago I wrote that the number of mutual funds has exploded while the number of companies listed has declined. In fact, back in 2010 there were over 7,500 mutual funds compared to around 5,00o stocks.

Today there are over 5,000 indices. But the total number of listed US stocks stood at just 4,331 at the end of 2016 according to World Federation of Exchanges.

From an investment point of view, rising number of indices and mutual funds relative to the number of listed companies is not good.

Updated:


Source: Bloomberg

Related:

Which Canadian Banks Have High Exposure To The US Market?

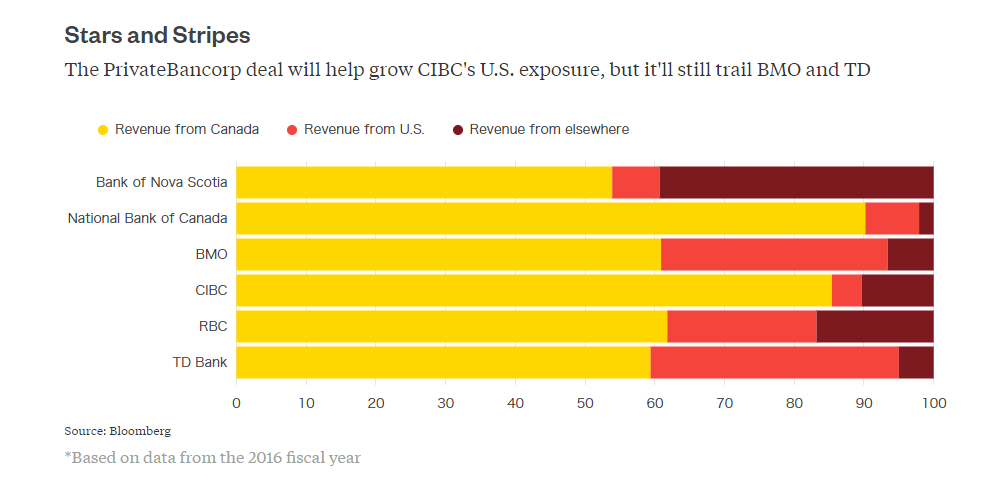
The Canadian banking industry is saturated as the market is small. So large domestic tend to diversify among other markets The US is one of the obvious choices for these banks due to close proximity and the size of the market. Among the six major Canadian banks, TD has the most exposure to the US followed by BMO. National Bank of Canada depends on the domestic market for most its revenues. Of the other large five banks CIBC is most exposed to the local market. Hence CIBC is acquiring Illinois-based PrivateBancorp(PVTB) in order to expand in the US.

Click to enlarge

Source: CIBC’s Close Call Is Cold Comfort for Canadian Banks, Bloomberg

Outside of Canada, Bank of Nova Scotia generates more of its revenues from regions other than the US. Much of this revenues comes from the Caribbean and Latin American countries where the bank has a large presence.

The five major Canadian banks listed on the US exchanges are shown below with their current dividend yields:

1.Company: Bank of Nova Scotia (BNS)
Current Dividend Yield: 4.16%

2.Company: Bank of Montreal (BMO)
Current Dividend Yield: 3.76%

3.Company: Canadian Imperial Bank of Commerce (CM)
Current Dividend Yield: 4.86%

4.Company: Royal Bank of Canada (RY)
Current Dividend Yield: 3.82%

5.Company: Toronto-Dominion Bank (TD)
Current Dividend Yield: 3.89%

Note: Dividend yields noted above are as of May 12, 2017. Data is known to be accurate from sources used.Please use your own due diligence before making any investment decisions.

Disclosure: Long all five banks listed above.