Some of the emerging market countries are commodity-based economies. In these countries the price of a single commodity or a few commodities can have a strong impact on the overall performance of the economy and equity markets. This theory can be illustrated by looking at the country of Chile.
The Chilean economy is highly dependent on copper. So when copper prices go up the economy thrives and equity markets follow. When copper prices are in a downward trend its the other way around. Copper accounts for about 15 to 20% of the Chilean GDP and over 50% of its exports. So the price of copper has a huge impact on the Chilean economy.
Copper prices declined by about 60% since its peak in 2010.
Click to enlarge
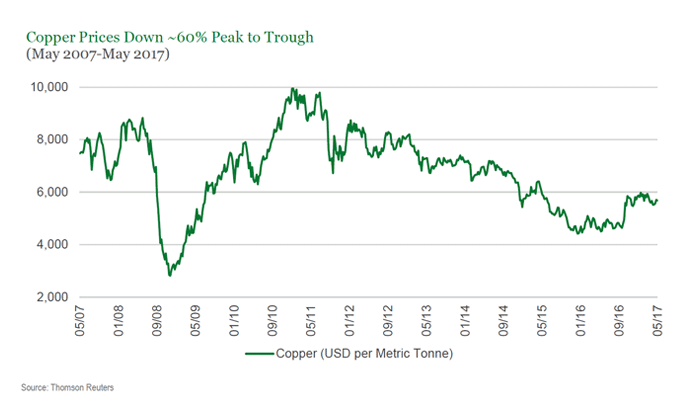
Source: It’s Copper’s Time to Shine, Manning & Napier
When copper prices plunged so much Chilean equities also fell strongly. The chart below compares the performance of the Chile ETF(ECH) and copper ETF(CPER) over the past 5 years:
Click to enlarge
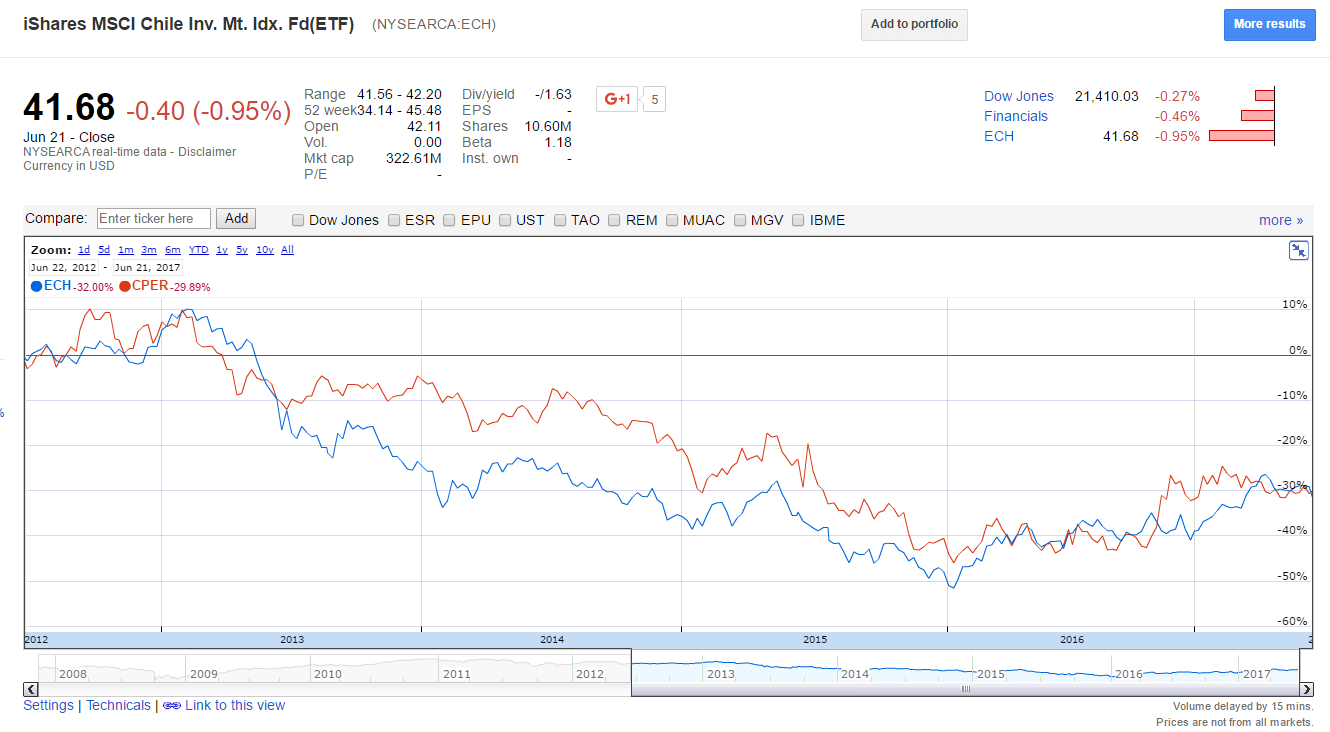
Source: Google Finance
The above shows the synchronized performance of the copper ETF and the iShares country ETF for Chile.
As the price of copper has recovered over the one-year period the equity ETF has has followed as well. CPER is up 23% in 1 year and ECH is up 15%.
The key takeaway is that in commodity-based economies it is important to follow and include the state of commodity prices when making investment decisions. With copper prices rising, now may be a good time for investors looking to gain exposure to Chile to add some Chilean stocks or ETFs to their portfolios.
Disclosure: No positions