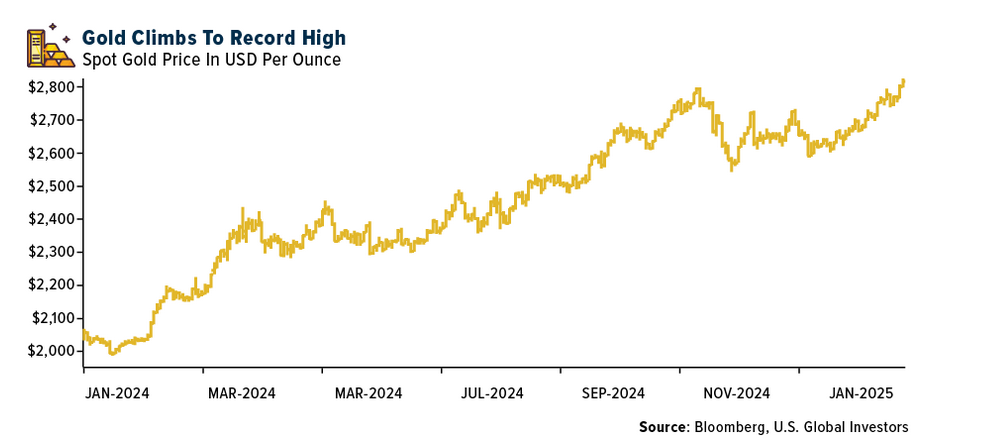
Gold prices closed at XX$/oz yesterday. Since late 2012 gold prices have been on a slow decline although they have recovered some since last year.Despite the recovery prices are nowhere near $2000/0z that some expert predicted at the peak of the gold bull market.
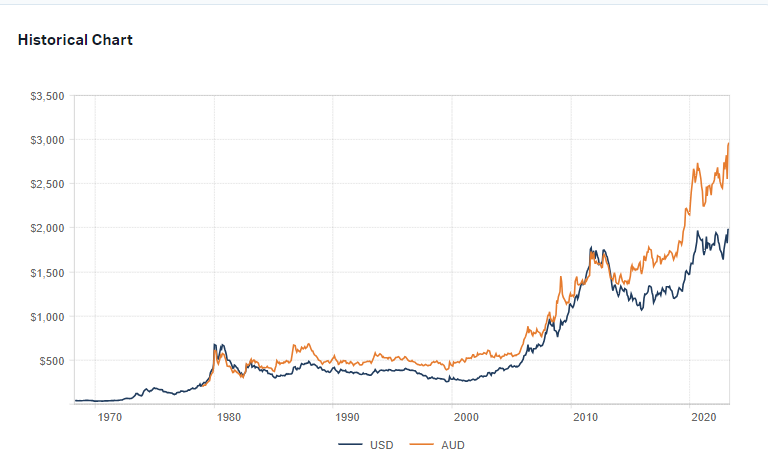
In the past gold has had brutal price plunges during bear markets. For instance, from 1996 to late 2000 prices fell over 70%. The following chart shows the historical gold bear markets since 1942 using the Barron’s Gold Mining Index (BGMI):
Click to enlarge
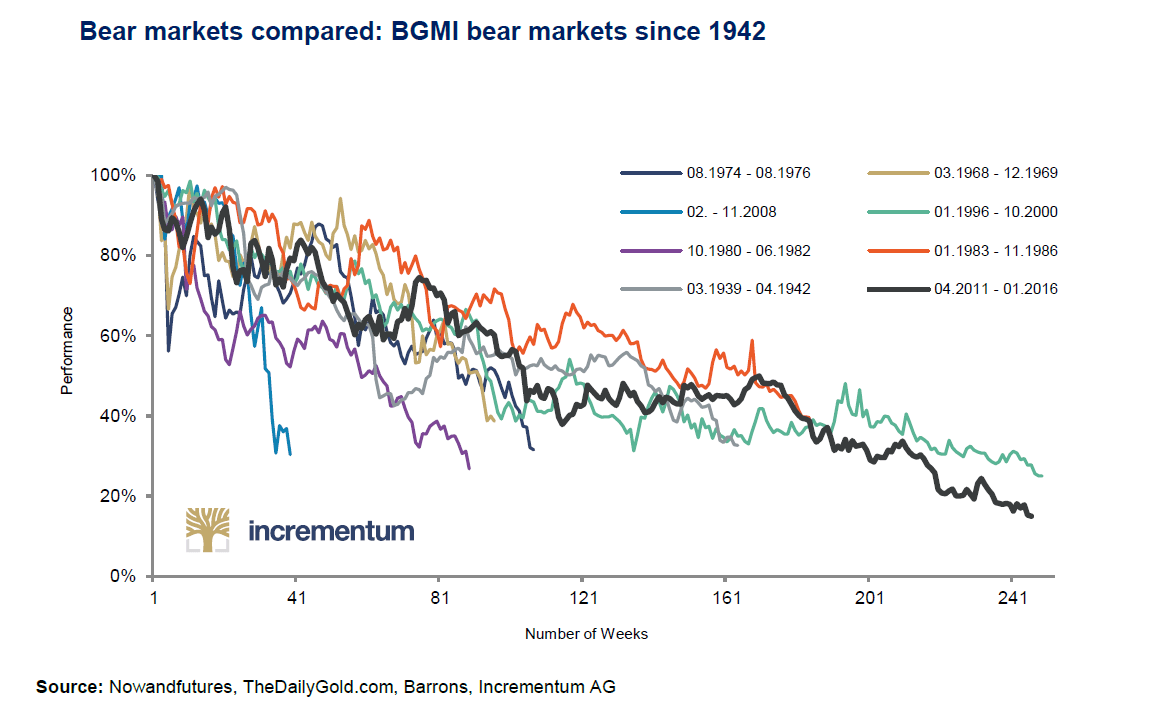
Source: In Gold We Trust, Incrementum
Download: In Gold We Trust 2017 report (in pdf format)
Related ETF:
- SPDR Gold Shares Trust(GLD)
Disclosure: No positions