Market Capitalization of US vs. Other Equity Markets 2019: Chart

The U.S. equity market accounts for just over half of the global equity market capitalization. Developed markets outside of the US, emerging and frontier markets account for 46% of the world market capitalization. So investing in just US equities will not capture the potential growth of these markets according to an article by Wes Crill at S&P Global.

Click to enlarge

Source: Why Should You Diversify, S&P Global

I agree with Wes. US equity investors must diversify globally. Simply going with US multinationals to capture the growth of foreign markets does not work in all scenarios.

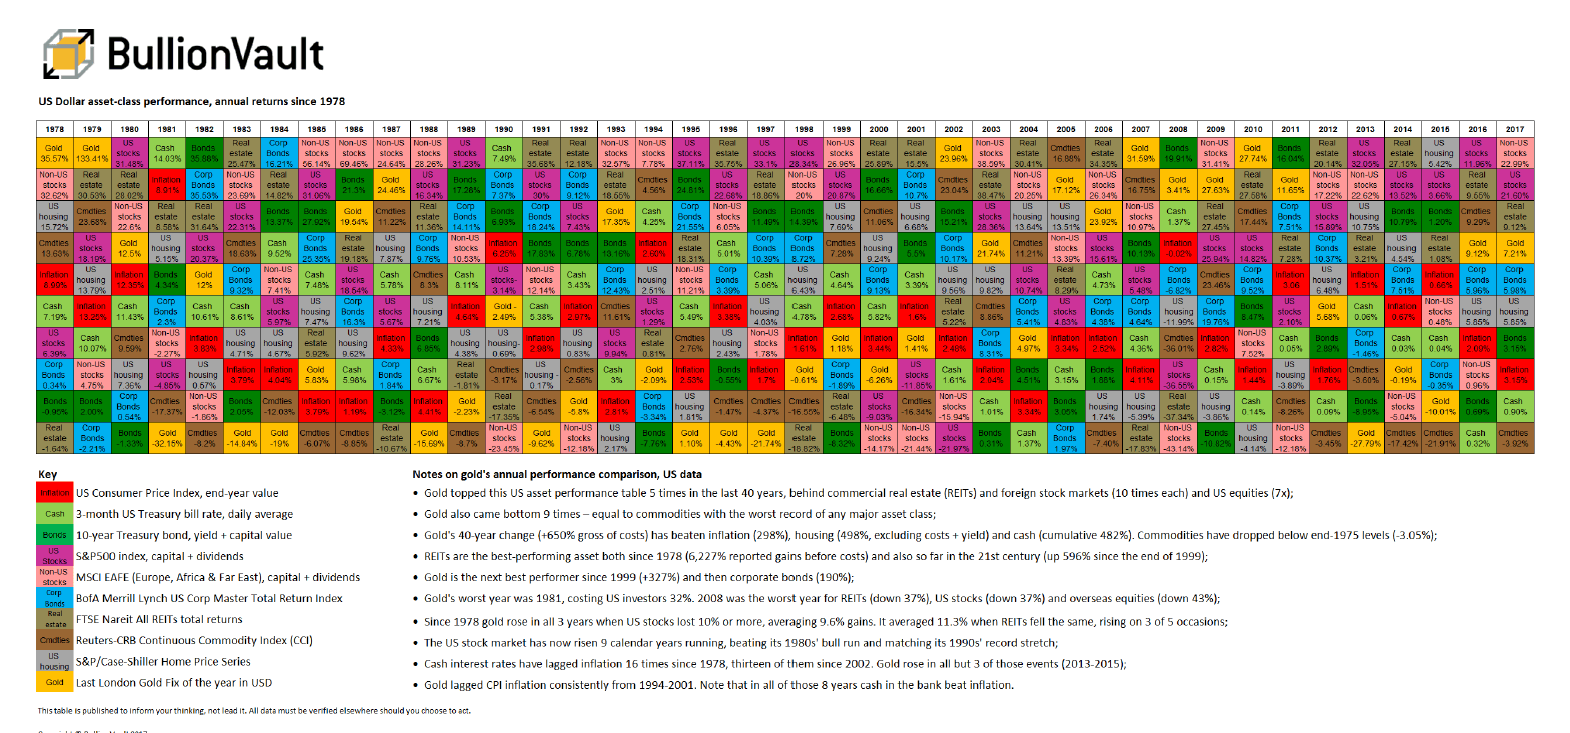
Annual Returns of Gold vs. Other Assets 1980 To 2019: Chart

Gold is an important asset class that is good to own during bull and bear markets although a small portion of a well-diversified portfolio should suffice. During bull markets in equities gold may not earn high returns. However during bear markets or when uncertainty plagues the market such as now then gold is a great asset to have in one’s portfolio. The soaring prices of gold is evidence of this. With that said, how has gold performed over other asset classes in the past few years?

The following chart provides some answers. It shows the annual returns of gold and other asset classes such as cash, US stocks, bonds, etc. from 1980 to 2019:

Click to enlarge

Source: Bullion Vault

Gold was the best performer during past crises such as in 2002 when US stock plunged. Ever since the dot com crash, gold has yielded positive returns in all the years except in 2013, 2014 and 2015.

Related ETF:

  • SPDR Gold Trust(GLD)

Disclosure: No positions

Average Holding Period for U.S. Stocks is Just 5-1/2 Months in 2020

The average holding period for US stocks has been declining for many years now. In the 1940s the average duration was 7 years. By the turn of this century it had fallen to below 1 year according to an article I wrote in 2010. A recent study earlier this year by researchers at MFS showed the holding period for NYSE-listed was 9 months.

A Reuters article noted that the average holding period for US stocks has declined to 5-1/2 months in June. From the article:

The length of time that investors hold shares has been shrinking for decades but the trend accelerated this year in volatile markets that have made people nervous about sitting on investments for too long.

There are different ways of slicing it, but Reuters calculations based on New York stock exchange data show the average holding period for U.S. shares was 5-1/2 months in June, versus 8-1/2 months at end-2019.

The previous record low of six months was hit just after the 2008 crisis. In 1999, for example, 14 months was the average.

Europe displays a similar trend, with holding periods shrinking to less than 5 months, from 7 months last December.


Source: Buy, sell, repeat! No room for ‘hold’ in whipsawing markets, Reuters

The reasons for the continuing decline in holding periods are many. Some of them include commission-free trading from discount brokers to others, 0% interest rates, pandemic-induced volatility, sports gamblers that are bored to death at home due to lack of sports betting, millennials living in their parents’ basements with nothing else to do, day-traders by the millions playing the market using the Robinhood app, unemployed people trying to multiply their $600+ weekly unemployment checks and also have fun doing it, the same people also throwing the $1,200 stimulus checks into the market to make some money to pay bills, etc. Not to mention algorithm-based machine trading by big institutions, locked-down realtors unable to flip houses finding their luck in the stock market, etc.

Whatever the cause, ultimately the inability of investors to hold stocks for the long-term is negative for the market and investors. Simply churning stocks all day long or even holding them for only a few months will not lead to a strong and growing equity market.

Related Posts: