10 Fascinating Facts About Oil

Oil is the most important commodities in the world. The price of crude oil impacts most of the global economies. Rising oil prices tend to be a boon to oil producing countries but adversely affect consuming countries. Despite being the most important and highly traded commodity, the price of oil is one of the mysteries of the modern world. Unlike other products, the economic concepts like law of supply and demand, capitalism, etc. does NOT apply to the oil market. In addition, while hoarding of a product to manipulate its price in the open market is illegal in all countries particularly strictly enforced in the developed countries, the oil market is an exception. Unlike any other market, cartels are legally allowed in the oil market whereby a group of countries can control the price of the oil. For example, cartels like OPEC does not exist and are not legally allowed for other commodities or products such as milk, beer, copper, iron ore, gold, etc.

With Brent oil prices now trading at over $72 per barrel for September 2018 delivery, some experts are predicting prices to reach over $100 soon.

Canadian magazine Maclean’s published an article titled What fuels oil prices? by Atif Kubursi, McMaster University on Friday discussing the factors that drive the price of oil. The following are some of the key takeaways and my comments from that article:

  1. The price we pay at the pump is determined more by politics than supply and demand.
  2. Oil prices are not determined by the supply and demand of physical oil. In fact, every barrel of physical oil is now traded nine to 12 times on future markets.
  3. The demand for oil is known as what’s called price inelastic.This means unlike other products demand does not collapse when prices rise to very high levels. For example, even at $4 a gallon a few years people had to use their cars. Though demand slightly decreased because there is no substitute for oil, people could not simply stop filling at the pump despite the exorbitant prices.
  4. But small changes in supply immediately impacts oil prices. For instance, some warlord in Libya shutting down a well or some guys with blowing up a pipeline Nigeria will lead to jump in prices.
  5. Oil is the world’s primary source of commercial energy.
  6. Seven large, fully integrated multinational corporations flying the flags of primarily two countries (five of them American and two European) dominate the global oil market.
  7. Though oil is produced in many countries, production costs vary widely. The marginal cost (the cost of producing an additional barrel of oil) is lowest in Saudi Arabia at US$8.98 per barrel; the highest in the U.K. at US$44.33. In Canada, it’s $26.24.
  8. Saudi Arabia has the lowest cost of production. (On a related note, though the US produces almost an equal amount of oil like Saudi Arabia, the Saudis still hold the power to control the price of oil. This is oil production in the US is in the hands of hundreds of shale producers and NOT by a single company. So the Saudis, not the US, get to determine the price of oil in the global market).
  9. Oil producing countries such as Saudi Arabia and Russia need at $100 a barrel to balance their budgets.
  10. Production of oil concentrated in few areas and few hands. For instance, a small group emerging countries mainly the Middle East produce and export most of their oil to major consumers – the US, Japan, Western Europe and China.

Source: What fuels oil prices? by Atif Kubursi, McMaster University, Maclean’s 

Related ETF:

  • United States Oil Fund(USO)

Disclosure: No Positions

Related:

The Top 10 Countries With The Most Diabetes Sufferers: Chart

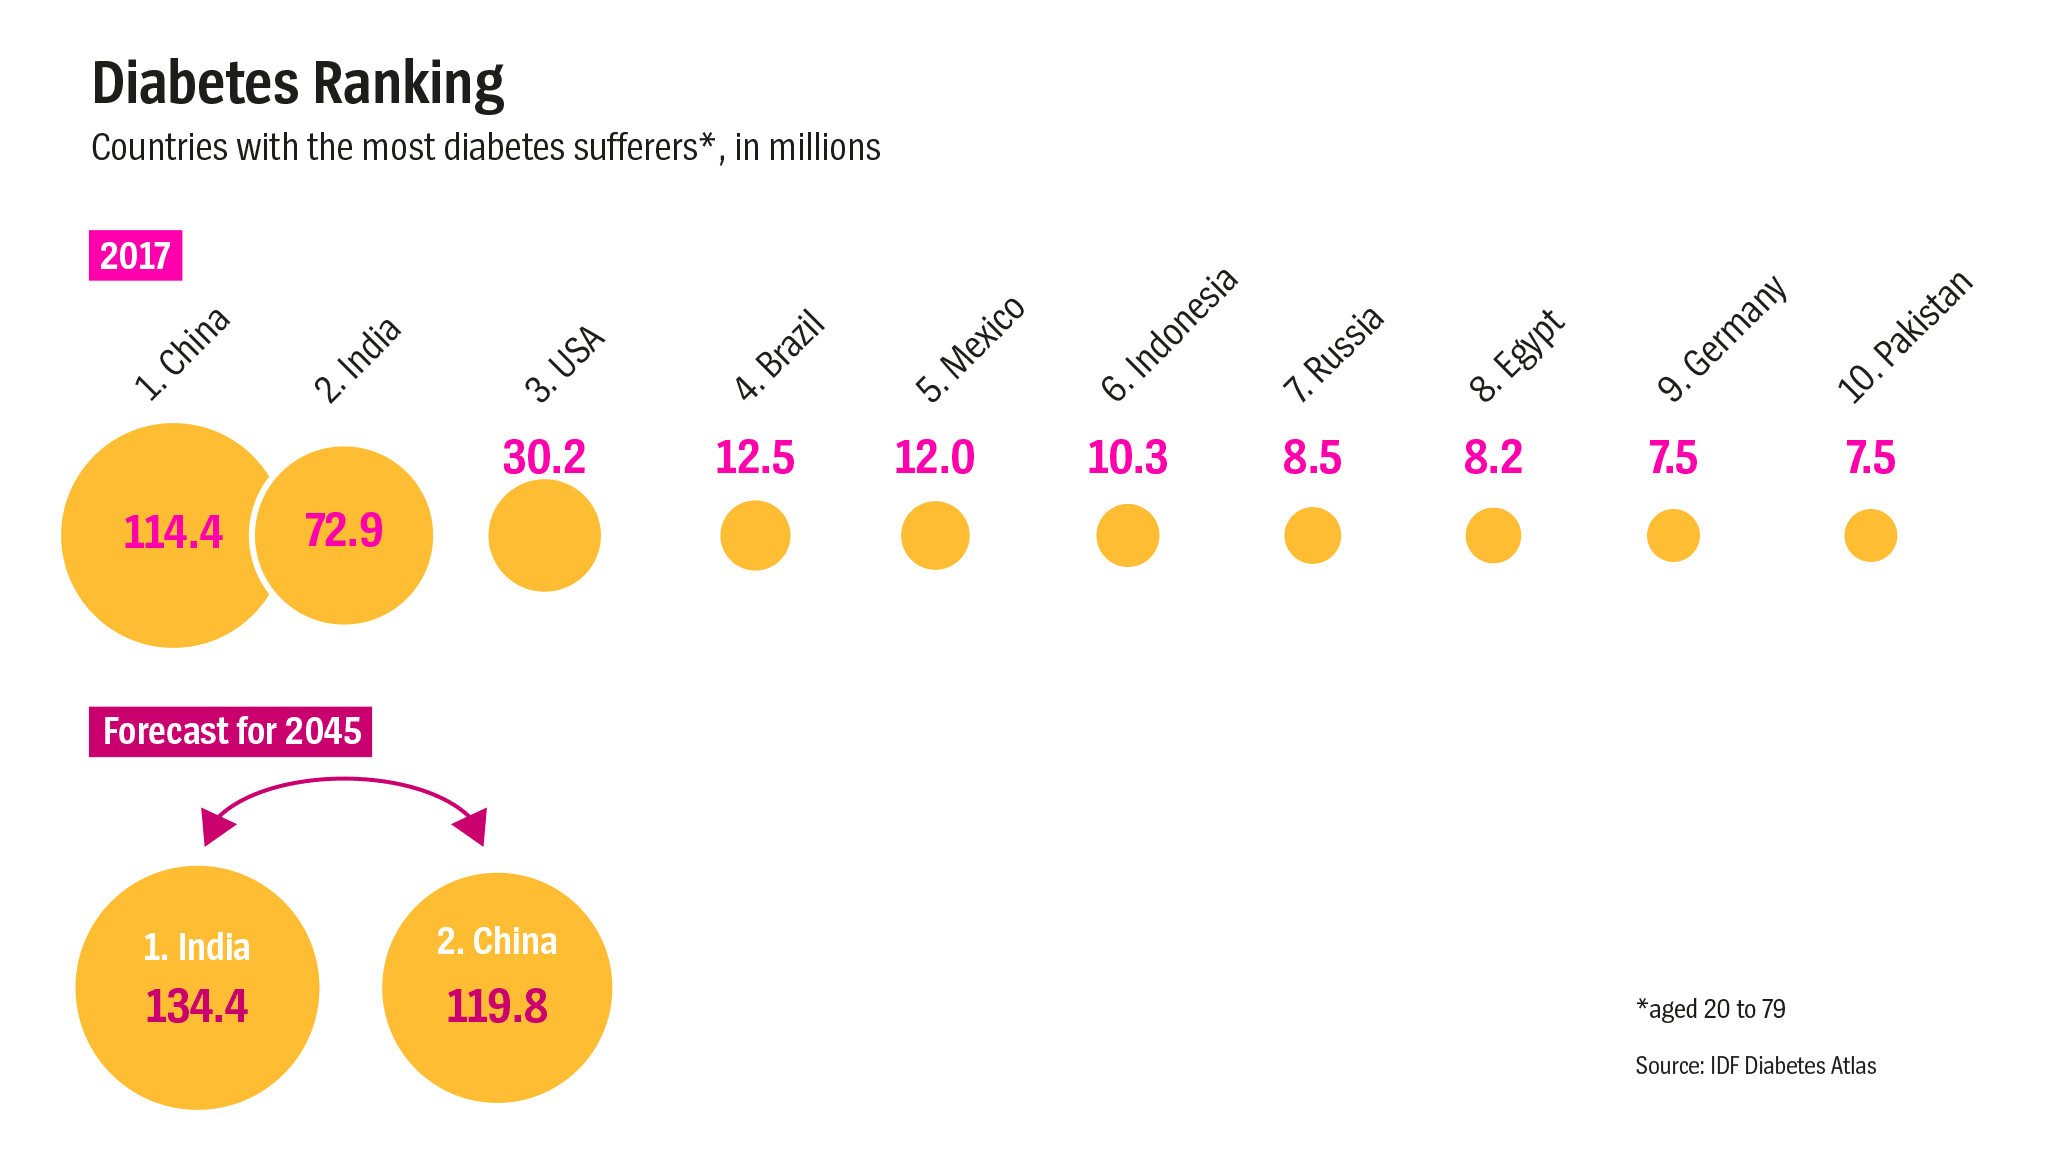
Diabetes is one of the top diseases affecting millions of people worldwide. Change in food habits especially in the emerging countries is leading to rises diabetes sufferers in these countries. China and India are the top two countries with most diabetes patients followed by the US. India is projected to overtake China by 2045.

Click to enlarge


Source: Fast Food NationStreet Vendors Take on Multinationals To Fight India’s Food Crisis, Der Spiegel

Five Stocks To Monitor For Potential Investment Opportunities

The US equity market has performed well so far this year with the S&P up by about 5%.Many of the foreign markets including the developed European markets are under-performing the US. With that said, there are plenty of opportunities for investors with a long-term view. The following are five stocks that investors can monitor for potential entry points:

1.Company: Continental AG (CTTAY)
Current Dividend Yield: 2.29%
Sector:Auto Components

Continental has fallen from a recent high of over $61 to $46 now.

2.Company: General Mills Inc (GIS)
Current Dividend Yield: 4.55%
Sector: Food Products

The consumer staples sector is out of favor now. In addition, General Mills has made an expensive acquisition in the pet food space. However food items such cereals are not going to disappear anytime soon.

3.Company: Ecopetrol SA (EC)
Current Dividend Yield: 3.10%
Country: Colombia

After reaching over $23 the stock is currently trading the $20 range. EC is a risky bet but higher oil prices from current levels should help the Colombian oil major go even higher.

4.Company: Royal Dutch Shell PLC (RDS.A)
Current Dividend Yield: 5.46%
Sector: Oil, Gas & Consumable Fuels
Country: UK

5.Company: Magna International Inc(MGA)
Current Dividend Yield: 2.15%
Sector: Auto Components

Note: Dividend yields noted above are as of July 19, 2018. Data is known to be accurate from sources used.Please use your own due diligence before making any investment decisions.

Disclosure: Long CTTAY, GIS, EC and MGA

US Economic Expansions Since World War II

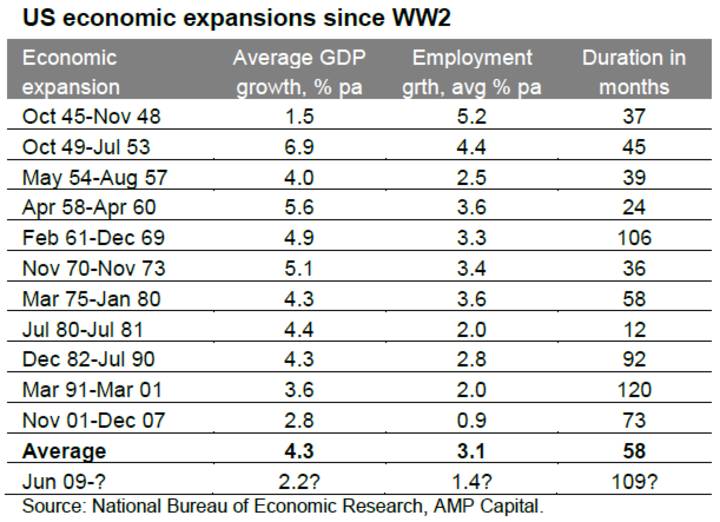
The cyclical bull market in US equities continue. Benchmark indices like the NASDAQ are establishing record highs and investors can’t get enough of some of the big tech names. Naturally some investors are wondering if the current euphoria in the stock market will come crashing down and the bull market will suddenly come to a dead stop. The current bull market that started in the depths of financial crisis in March 2007 is 112 months old.

The bull market has followed a strong economic expansion. In fact, the current expansion at 109 months is one of the largest economic expansions since World War II as shown in the chart below:

Click to enlarge


Source: The US economy – does the flattening yield curve indicate recession is imminent? by Dr Shane Oliver, Head of Investment Strategy and Economics and Chief Economist, AMP Capital

August Is The Worst Month For Emerging Market Equities

Many emerging market stocks have performed poorly so far this year. After a strong run until last year, emerging markets have declined this year due to a multitude of factors including rising oil prices, impact of trade war initiated by the US, rising US dollar, etc. Hence some of the major markets of the developing world are down. For example, Mexico’s IPC Index is off by 1.9%, Chile’s IPSA is down by 6.7%, China’s Shanghai Composite is down by over 14%, etc. The benchmark MSCI Emerging Markets Index has declined by 7.15% in USD terms.

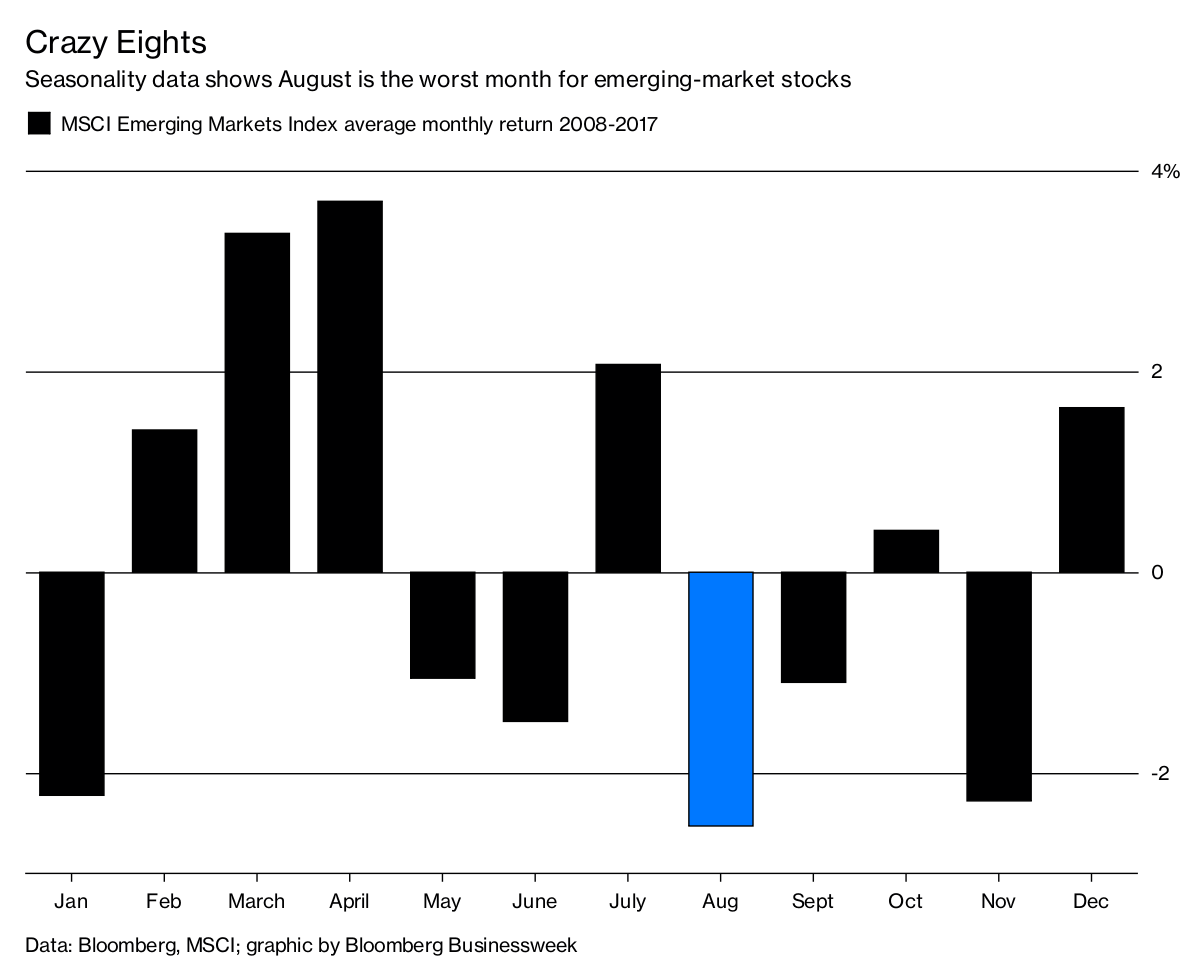
Given the under-performance of these markets, Lilian Karunungan of Bloomberg notes in an article that August has been historically the worst month for emerging market stocks.

Click to enlarge

Source: Emerging-Market Investors May Want to Skip Next Month, Bloomberg

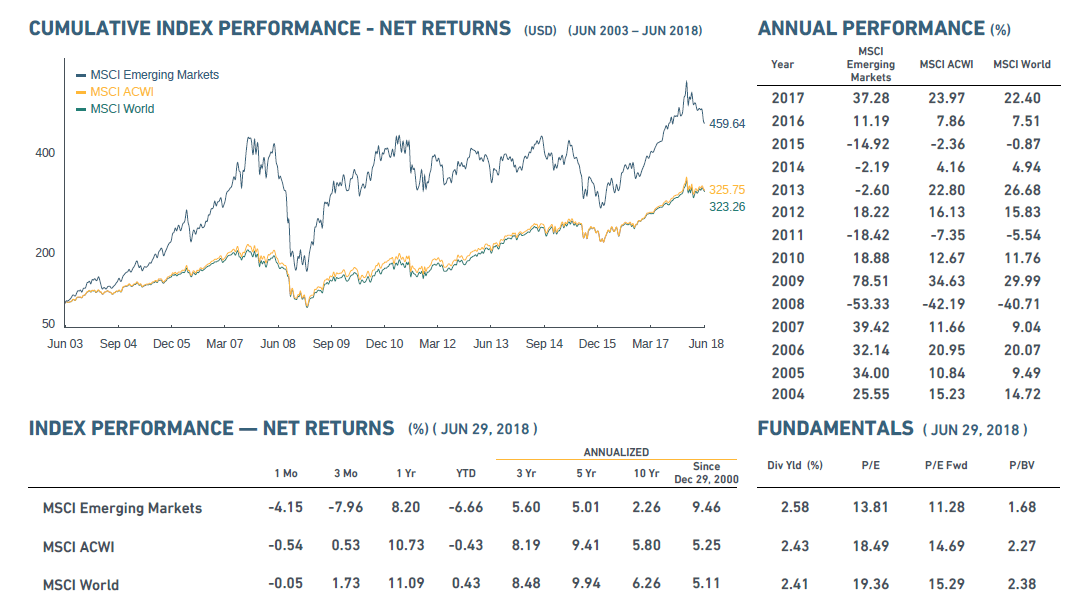
The Long Term Net Return for the MSCI Emerging Markets Index against two other major MSCI indices are shown in the chart below:

Click to enlarge

Source: MSCI

Related ETFs:

  • iShares MSCI Emerging Markets ETF (EEM)
  • Vanguard MSCI Emerging Markets ETF (VWO)

Disclosure: No Positions