Canada S&P/TSX Composite Index Annual Total Returns from 1920 to 2022: Chart

Canada’s benchmark S&P/TSX Composite Index is up by 7.12% on price return basis year-to-date as of December 21, 2023. The YTD total return, which includes reinvested dividends, is even better at 10.58%.

The TSX Composite Index has generated an annual total average return of 7.51% over the past 100 years from 1920 to 2022 according to a report by AGF Management Limited. As with other developed markets, there have been more positive years than negative during this period. Another point to remember is that many times negative years are followed by positive years as hi-lighted with one example in the chart below. This shows the importance of staying in the market for the long-term.

Click to enlarge

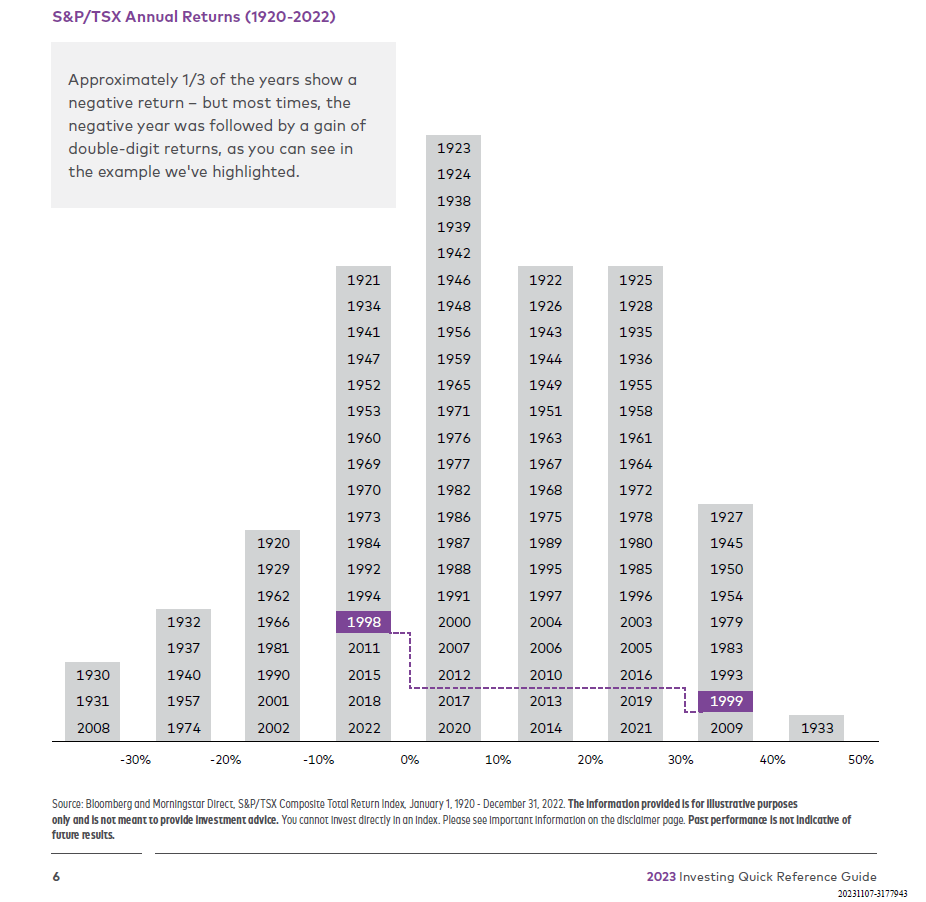
Source: 2023 Quick Reference Guide, AGF

Related ETF:

  •  iShares MSCI Canada ETF (EWC)

Disclosure: No positions

There Are Always Reasons NOT to Invest in Stock Market

Investing in equity markets involves risks. There are many types of risks and one of those is the risk of the unknown. Ideally investors would like to have a perfect world where there are no crises or unknowns so they can invest without having to deal with them. To put it another way, there are always reasons to not invest in the stock market. There are always one crisis or another that investors face. For instance, some of he risks that investors face include the ongoing crisis in the middle east, Ukraine-Russia war, etc.

I came the below graphic that shows 95 different reasons that investors had to invest in stocks since 1928. Over the decades there have been many crises from Cuban missile crisis to Vietnam war to the recent covid-19. Through all these crises stocks have gone up slowly higher as shown in the second chart below.

Click to enlarge

Source: 95 Reasons Why People Did NOT Invest in the Stock Market, Orion Portfolio Solutions

The key takeaway is that at any given time there will always be a reason not to invest in stocks. The trick is to ignore those noises and invest as per one’s risk tolerance and long-term goals.

Related ETFs:

  1. SPDR S&P 500 ETF (SPY)
  2. iShares Core S&P 500 ETF (IVV)
  3. Vanguard S&P 500 ETF (VOO)

Disclosure: No positions

Why Invest in Stocks and Bonds: Chart

Investing in equities and bonds is one of the best ways to grow wealth. This is especially true when it comes to long-term. Over many years or decades due to the effect of compounding stocks have historically generated the highest returns over bonds and other assets. The following chart shows the growth of $1 from 1926 to 2022. Small caps had a higher return than large caps in this long period. The chart also shows the return on bonds and T-Bills together with inflation.

Click to enlarge

Source: New York Life Investments

Related ETFs:

  1. SPDR S&P 500 ETF (SPY)
  2. iShares Core S&P 500 ETF (IVV)
  3. Vanguard S&P 500 ETF (VOO)

Disclosure: No positions