Dividend Withholding Tax Rates by Country for 2021

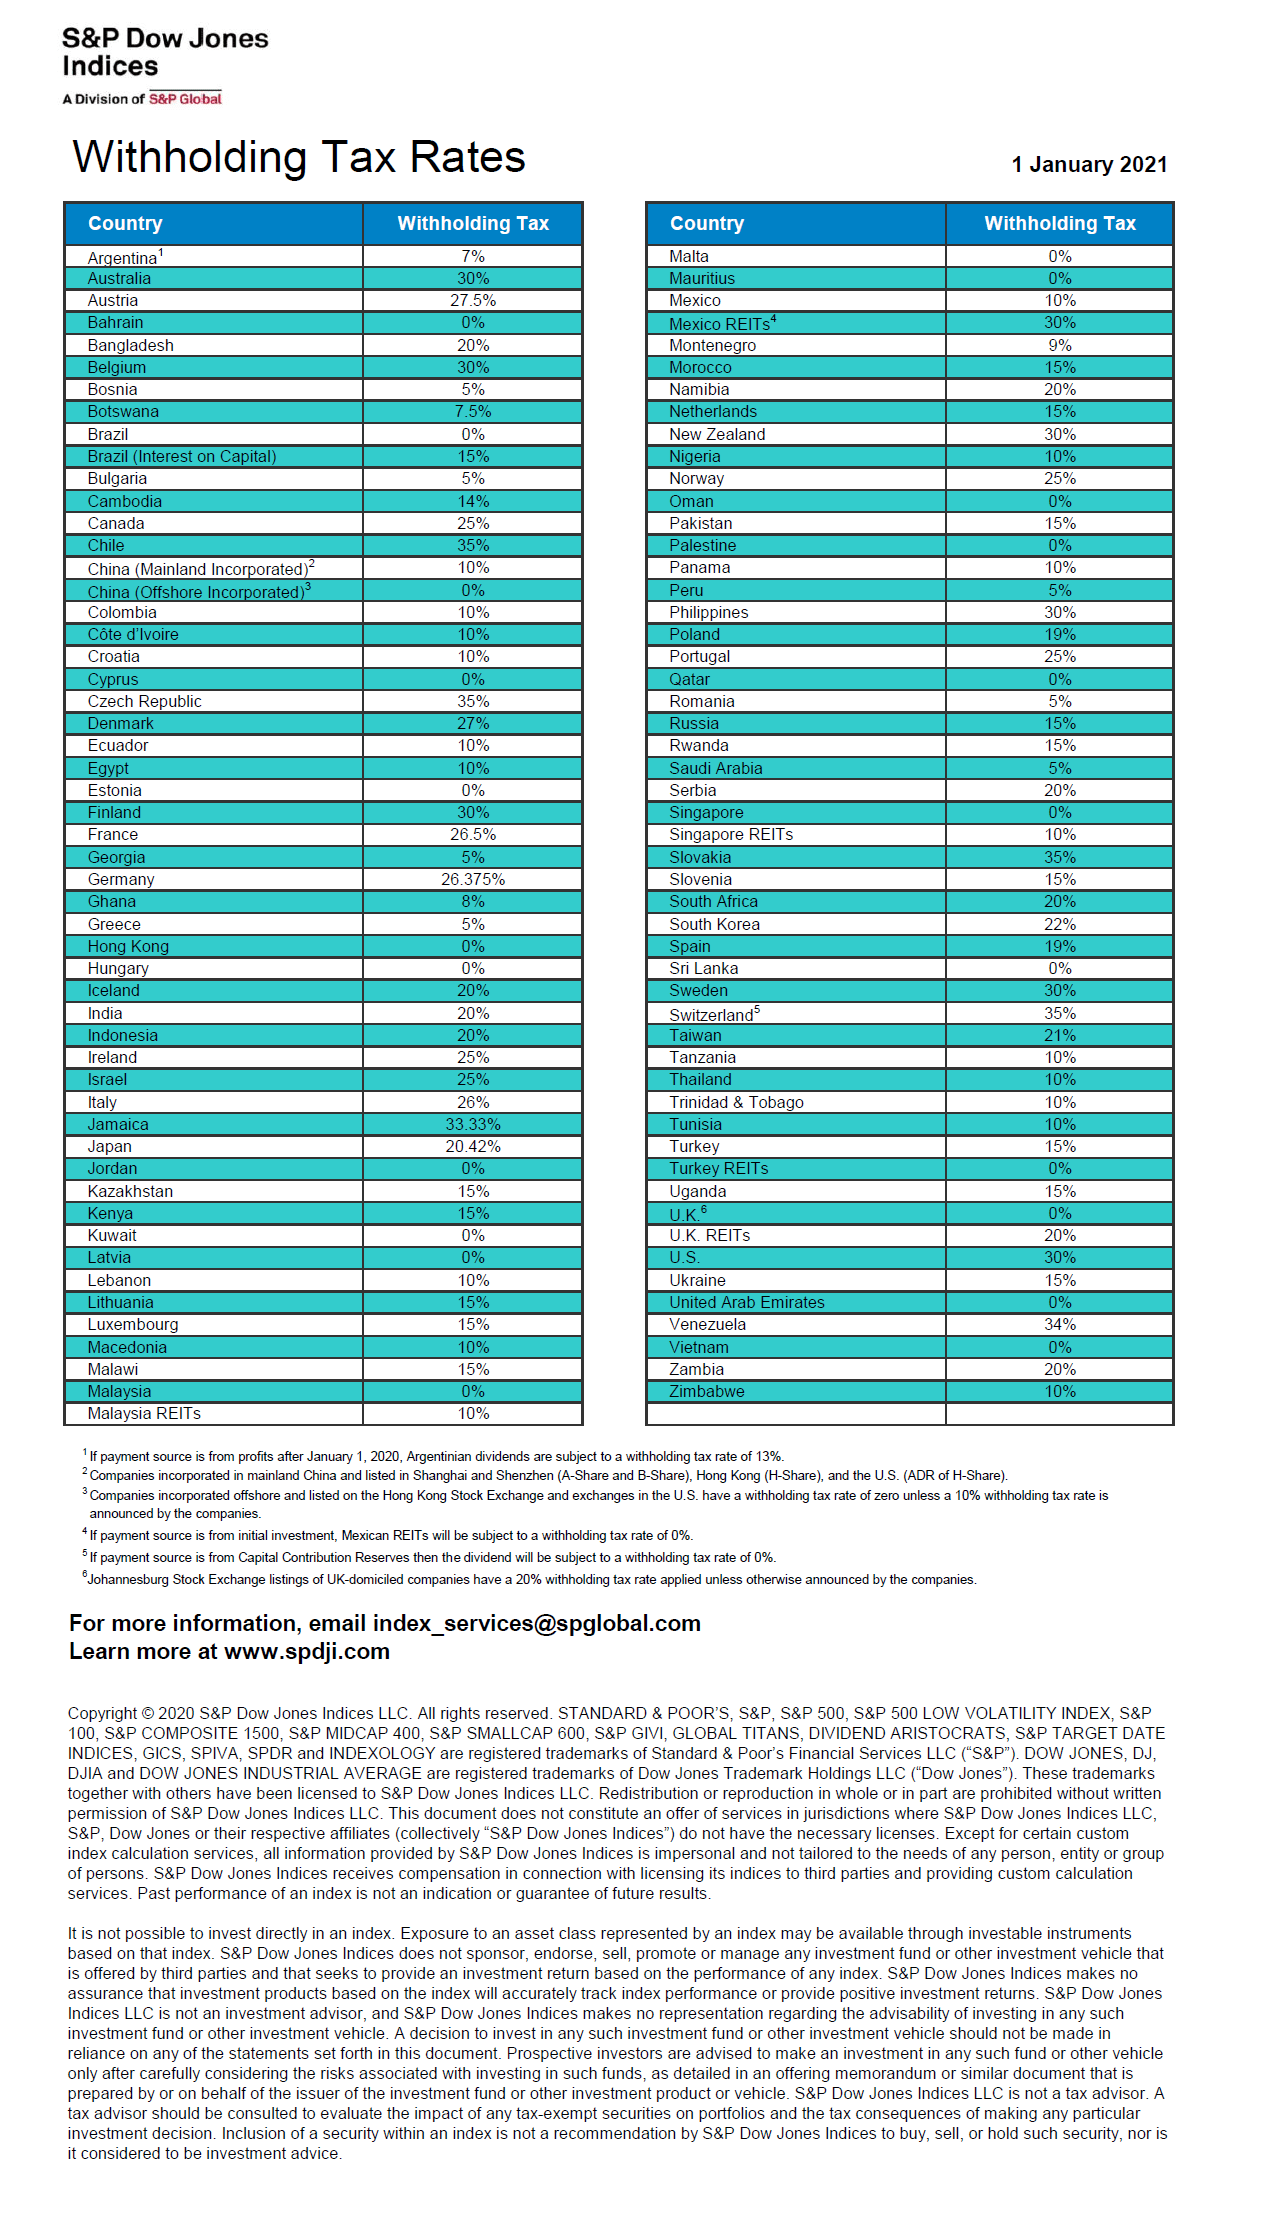
The Dividend Withholding Tax Rates by Country for 2021 has been published by S&P Global. This simple one-pager shows the updated withholding tax rates for each country. Certain countries such as Singapore, UK (excluding REITs), etc. are great for American investors since they do not charge withholding taxes for dividends. Others such as Colombia, Mexico, Thailand, etc. have a nominal tax rate of 10%. Among the high withholding tax rate countries are New Zealand, Denmark, Germany and Switzerland.

Update – Click this link for 2022 rates: Dividend Withholding Tax Rates by Country for 2022

Click to enlarge
Source: S&P Dow Jones

Asia:

a. India Dividend Withholding Tax :

1.What is the 2021 Withholding Tax Rate for Dividends paid to US investors?

20%.

2.What is the 2021 Withholding Tax Rate for 2021 for Dividends for Indian stocks held in qualified retirement accounts?

20%.

3.Does India waive the dividend Withholding Tax for stocks held in Qualified Retirement Accounts like IRAs, 401-Ks, etc.?

No. There is no special treatment for stocks held in retirement accounts.

4.What is the 2021 Withholding Tax Rate for REITs?

Same 20%.

5.Is there anyway to get a reduced Withholding Tax Rate?

No.

b. Singapore Dividend Withholding Tax :

1.What is the 2021 Singapore Withholding Tax Rate for Dividends paid to US investors?

0%. Singapore is one of the few countries in the world that charges no withholding taxes to US residents.

2.What is the 2021 Withholding Tax Rate for 2021 for Dividends for Singapore stocks held in qualified retirement accounts?

0%.

3.Does Singapore waive the dividend Withholding Tax for stocks held in Qualified Retirement Accounts like IRAs, 401-Ks, etc.?

Not applicable since Singapore charges 0%.

4.What is the 2021 Singapore Dividend Withholding Tax Rate for REITs?

10%.

5.Is there anyway to get a reduced Withholding Tax Rate?

No.

c. Australia Dividend Withholding Tax :

1.What is the 2021 Australia Withholding Tax Rate for Dividends paid to US investors?

30%.

2.What is the 2021 Withholding Tax Rate for 2021 for Dividends for Singapore stocks held in qualified retirement accounts?

30%.

3.Does Australia waive the dividend Withholding Tax for stocks held in Qualified Retirement Accounts like IRAs, 401-Ks, etc.?

No.

4.What is the 2021 Australia Dividend Withholding Tax Rate for REITs?

30%.

5.Is there anyway to get a reduced Withholding Tax Rate?

No.

_________________________________________________________________________

Latin America:

Europe:

Middle East and Africa:

_________________________________________________________________________
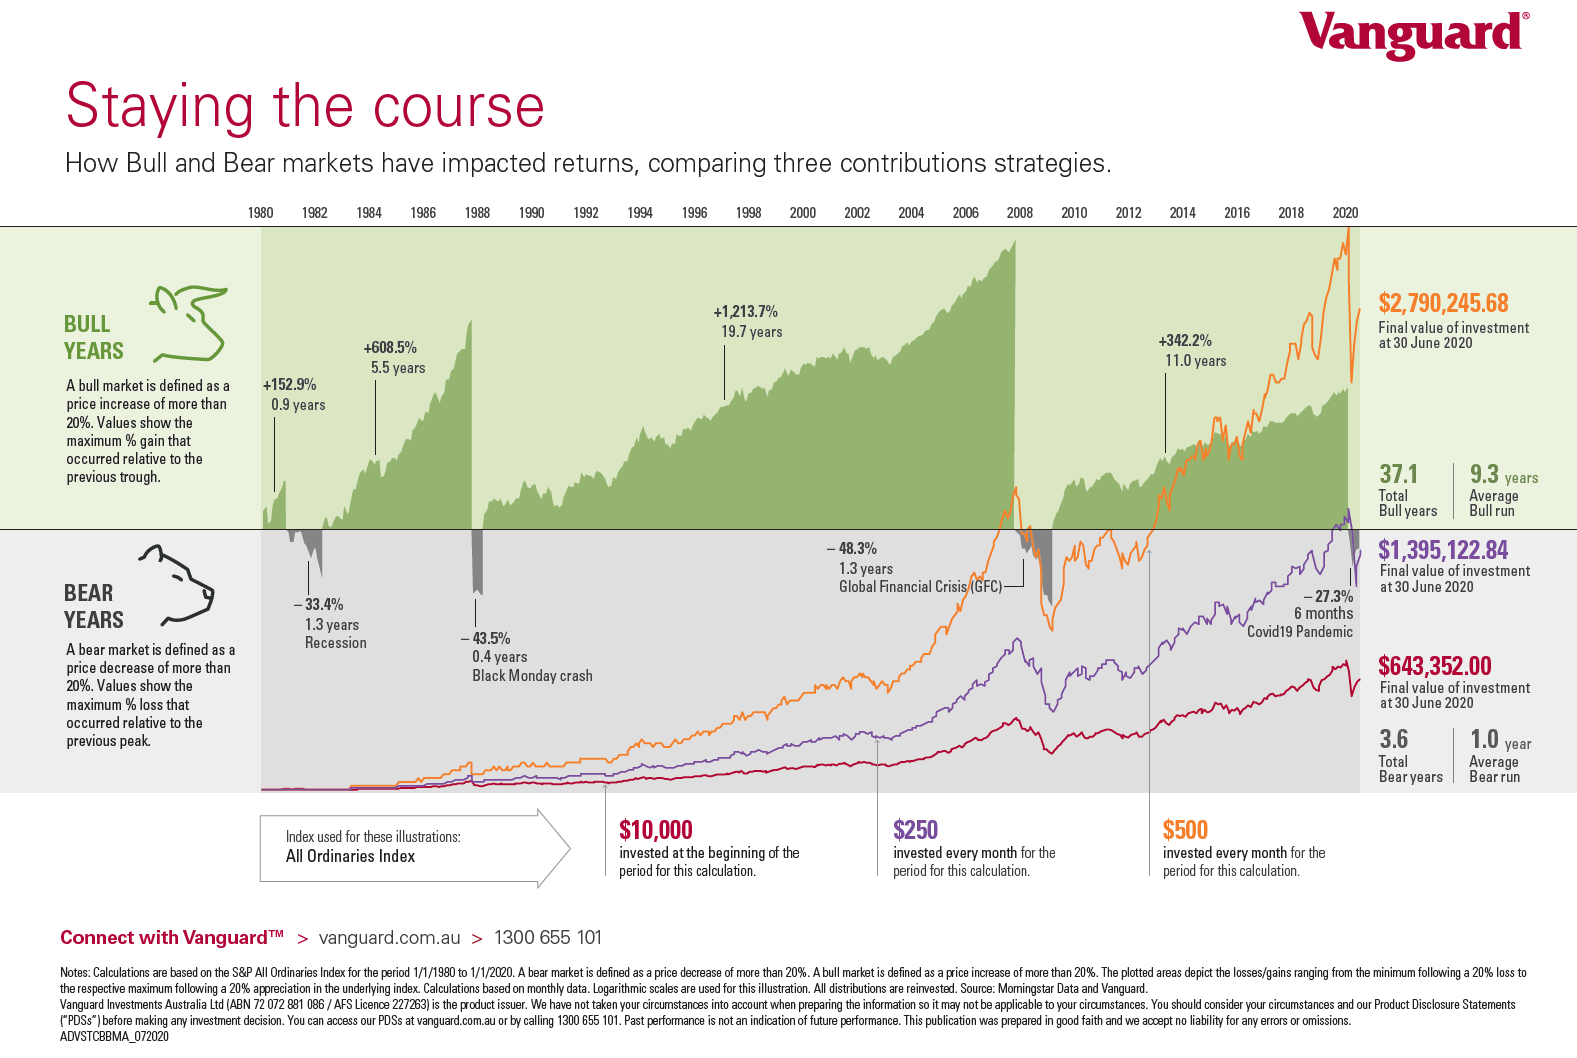
Bull and Bear Market Impact on Returns – An Australian Example

How do Bull and Bear Markets impact returns? The following chart shows the impacts based on three contribution strategies from an Australian perspective. The returns are from 1980 thru the end of June, 2020. Consistent monthly contributions yielded the highest return than a single one-time lump sum payment. Similar to the US market, the chart also shows that the average bull market is much higher than the average bear market.

Click to enlarge

Source: Vanguard Australia

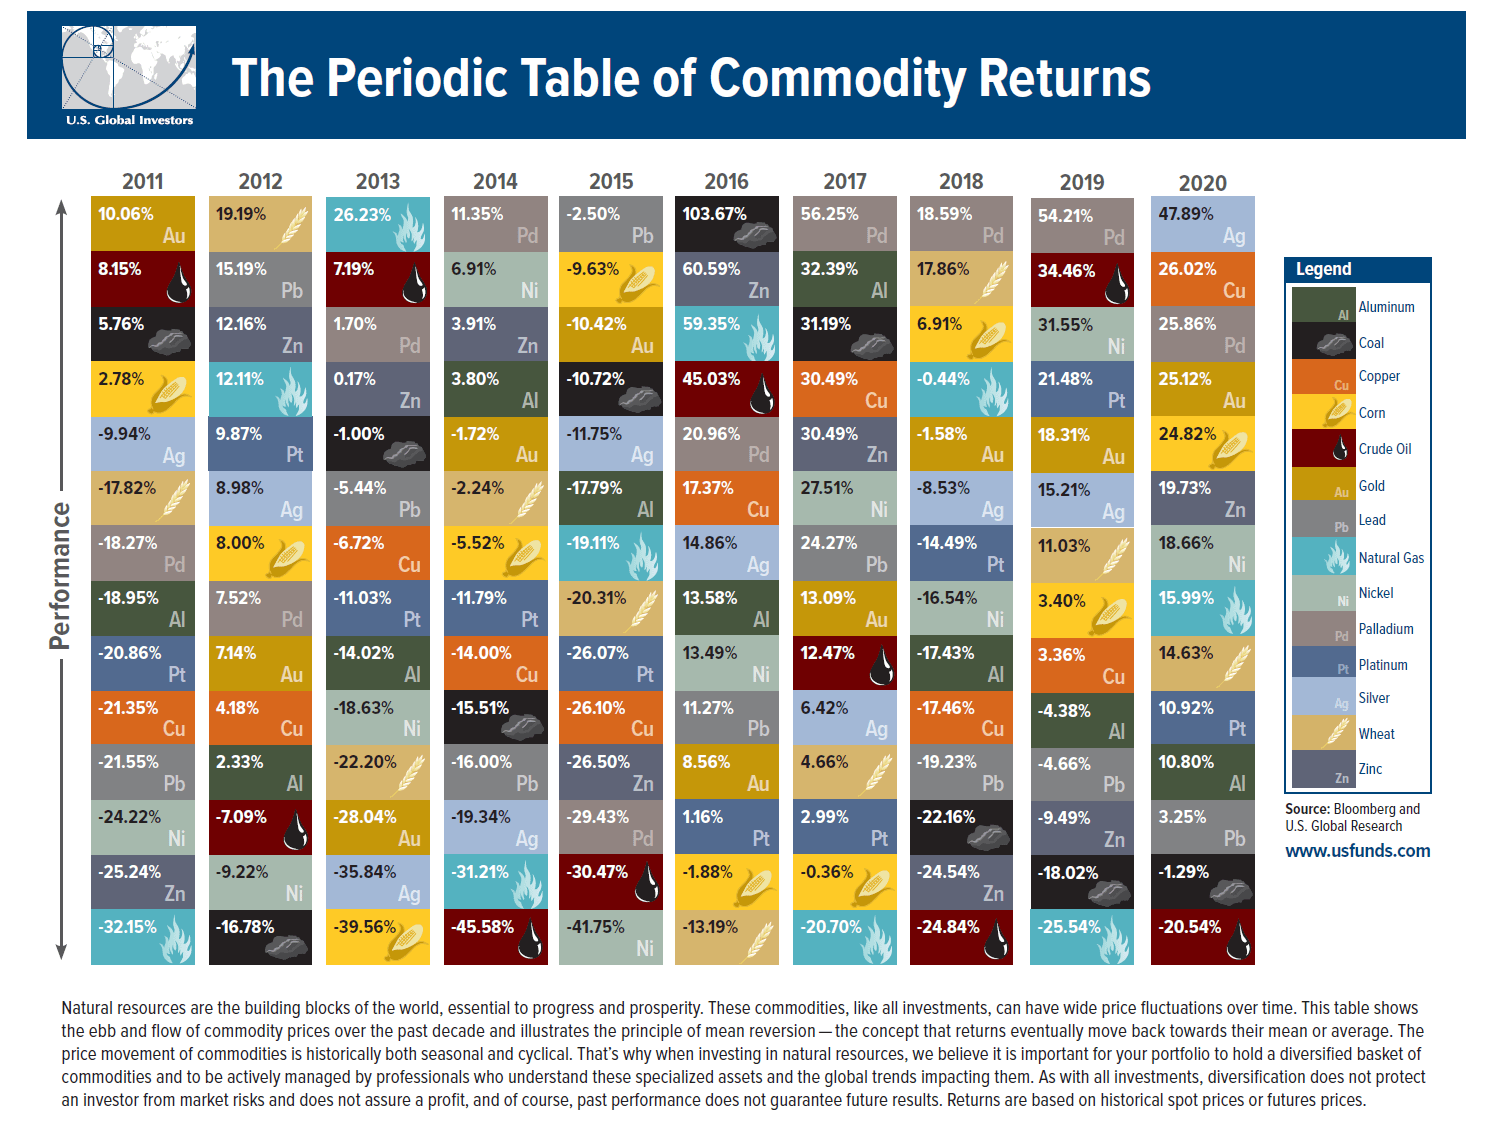
The Periodic Table of Commodity Returns 2020

The Periodic Table of Commodity Returns published yearly by US Funds is an excellent tool for commodity investors similar to The Callan Periodic Table of Investment Returns for US equity investors. Silver was the best performing commodity return last year with a return of about 48%. The next top returns came from Copper and Palladium, which was the best performer in 2019.  Soaring copper prices in later part of 2020 was a boon to the Chilean equity market as Chile as the world’s biggest copper producers. Accordingly Chilean equities including ADRs shot up in late 2020. As expected, Crude Oil ended up as the worst commodity due to the effects of the pandemic. Gold rose a decent 25% last year.

Click to enlarge

Source: U.S. Global Investors

Related ETFs:

  • SPDR Gold Trust ETF (GLD)
  • iShares Silver Trust (IAU)
  • iShares S&P GSCI Commodity-Indexed Trust (GSG)

Disclosure: No Positions

Update #2: NYSE to Delist Three Chinese Telecom Firms After All

The New York Stock Exchange reversed its plan again yesterday and announced it will delist the three Chinese Telecom Companies per the original plan announced on New Year’s Eve according an article in the WSJ. So China Mobile (CHL), China Telecom (CHA) and China Unicom (Hong Kong) Limited (CHU) will be delisted between January 7 and 11. More details on the delisting can be find in my earlier post:

You can find additional info on the latest reversal in the below WSJ piece:

Related articles: 

The journal also noted that the US is considering adding Alibaba Group Holding Ltd.(BABA) and Tencent Holdings Ltd  (TCEHY) to the delisting list. BABA fell over 5% yesterday and has a market cap of over $589.0 billion.

Currently over 200 Chinese firms trade on the US markets with a total market cap of over $2.2 Trillion.

Disclosure: No Positions

On The Adoption Patterns for Disruptive Technologies and Products

Innovation plays an important role in the success of a business. Companies that invest heavily in R&D and come up with market-leading technologies or products tend to be rewarded by consumers and investors. With new technologies such as Electric Vehicles, Battery technology, Artificial Intelligence, Robotics, Cloud Computing, Renewable Energy, etc. emerging faster and getting more media and investors’ attention it is important to understand how new technologies – especially disruptive ones – are adopted by the general public.

The Diffusion of Innovation Theory developed by E.M. Rogers in 1962 explains how innovative ideas and products are diffused (spread) over time through the general population. According to this theory, there are five established adopter categories:

  1. Innovators
  2. Early Adopters
  3. Early Majority
  4. Later Majority
  5. Laggards

Source: Diffusion of Innovation Theory, Boston University School of Public Health

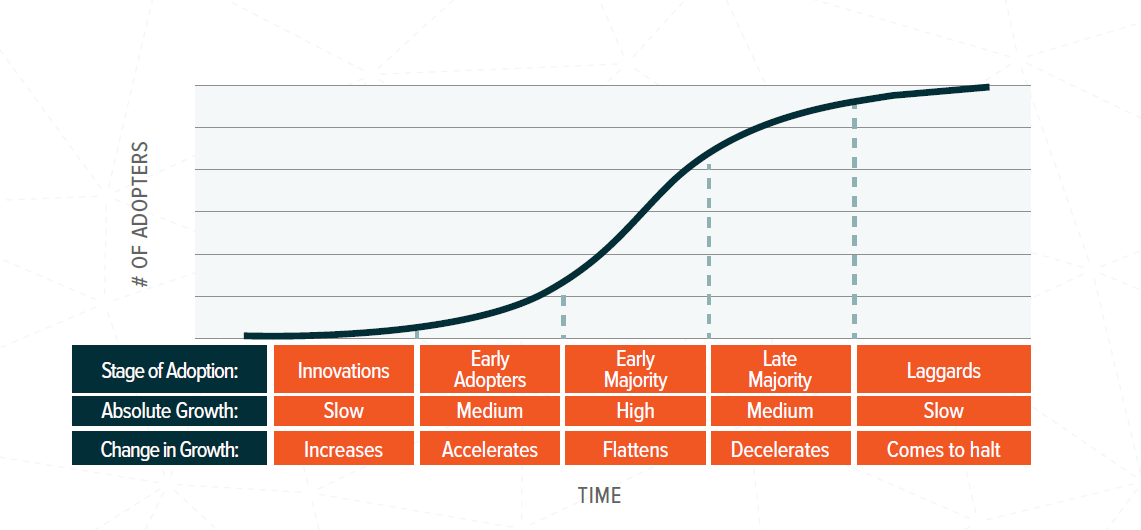
These five stages tend to follow an “S” shaped adoption curve as shown below from a report at Global X:

Click to enlarge

Electric Vehicles such as Tesla(TSLA) cars are in the Early Adopters stage now. The challenge for Tesla and other EV makers to dislodge the established dinosaurs like GM (GM), Ford (F), Toyota (TM), etc. and enter the majority stages. Of course, it is not the market cap that matters but wide adoption of the EV automobiles. Understanding in which stage an innovation stands can help investors determine the potential future trajectory of the product or company.

The same logic can be applied to other innovations. For example, ideas like space tourism in which millions of tourists can visit moon and beyond or delivery of things like a burger by a drone directly to our homes or flying taxis are just hype and will die out eventually.

But other innovations like renewable energy generation using wind, sun, waves, etc. , cloud computing, use of AI, etc. are in early stages of adoption.

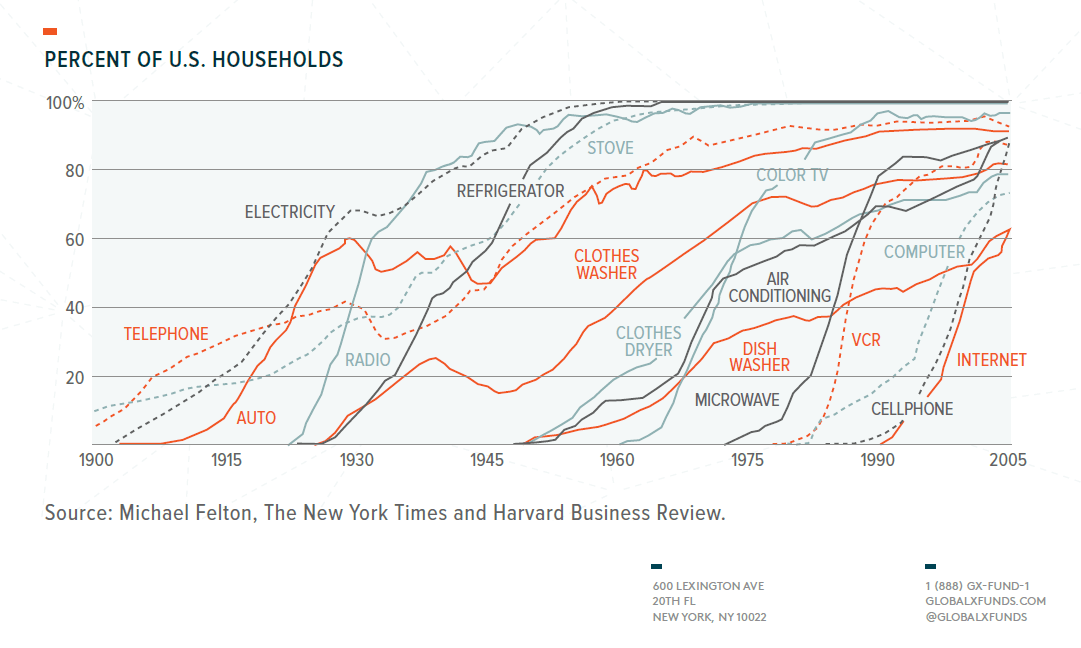
With that said, past innovations can provide us some evidence. Historical data shows while most of the innovations follow the “S” curve not all of them did:

Click to enlarge

SourceINVESTING IN TOMORROW – A WHITEPAPER ON THEMATIC INVESTING by Jay Jacobs, CFA, Director of Research, Global X Funds

Disclosure: No Positions