Inflation is rising in the U.S. Last week we learned that inflation shot up to 4.2% in April, the highest since 2008. Inflation can be considered as the stealth tax since it sneaks up on people when most are not looking or paying attention – usually in small increments. Inflation also reduces the purchasing power of the dollar. Or to put it another the dollar’s worth or value declines.
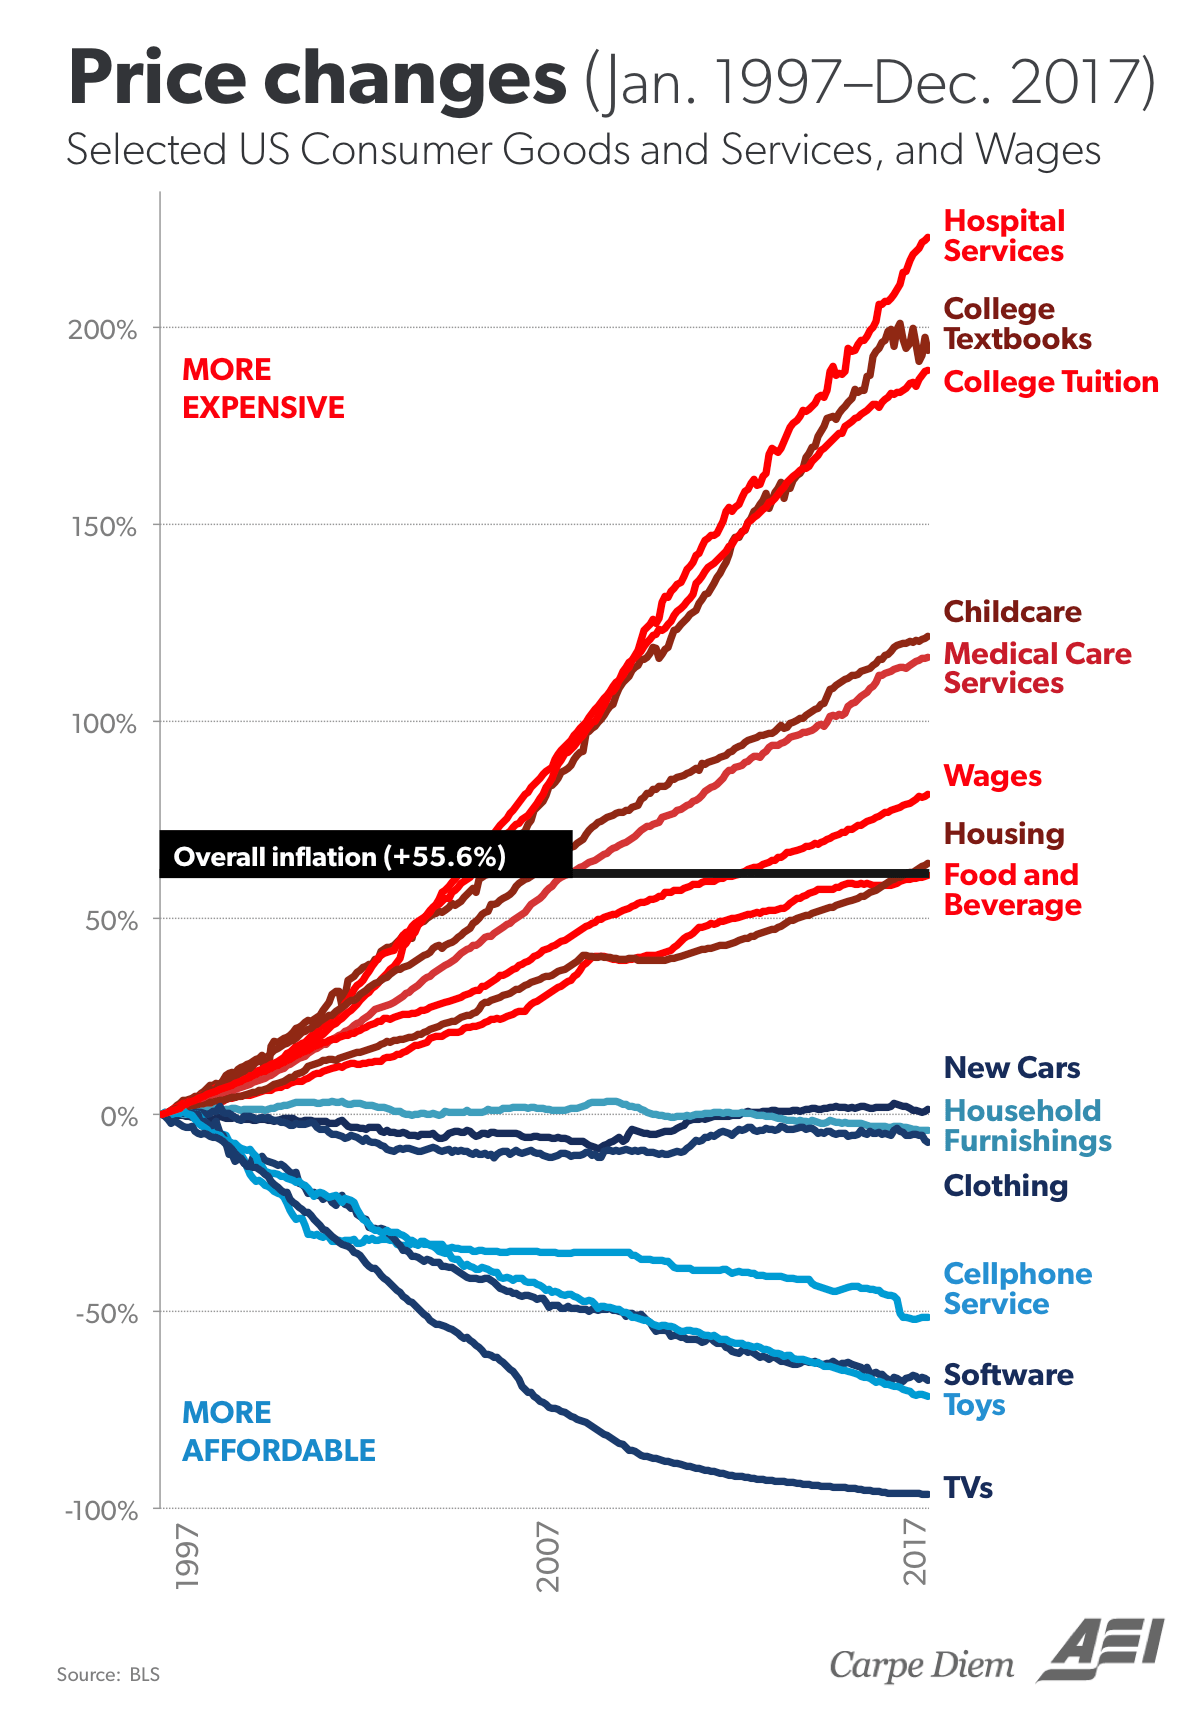
Below is a chart from 2018 that shows the price changes of select consumer goods, services and wages in the US from Jan, 1997 to Dec, 2017:
Click to enlarge
Source: AEI
All the things that are necessary for a decent life have become more expensive in the US. These are shelter, an education and health care. Everything else including junk food, tv, toys, gasoline, etc. are cheap.
Blue lines are prices that are subject to market forces while red lines denote prices subject to heavy regulatory capture by the government.