Volatility is One Hurdle to Cross to Achieve Long-Term Goals

The S&P 500 is up about 13% so far this year. In the first quarter US equity markets had a smooth sailing. However volatility returned in the second quarter with last week had four down days in a row. Fear of rising interest rates and inflation caused market participants to evaluate the strength of the current economic recovery and the headwinds stocks will face moving forward.

It is too early to confirm if inflation will continue to linger for many months and the inflation rate will head even higher. The Fed has stated it is transitory. There are signs that inflation could decline, if not totally disappear. For example, a few days ago the journal reported that lumber prices are down 41% from the recent record. This should have a positive impact on housing prices though it may take a few months. Similarly prices of menu items at restaurants could decline as labor supply increases with many states cutting down unemployment benefits.

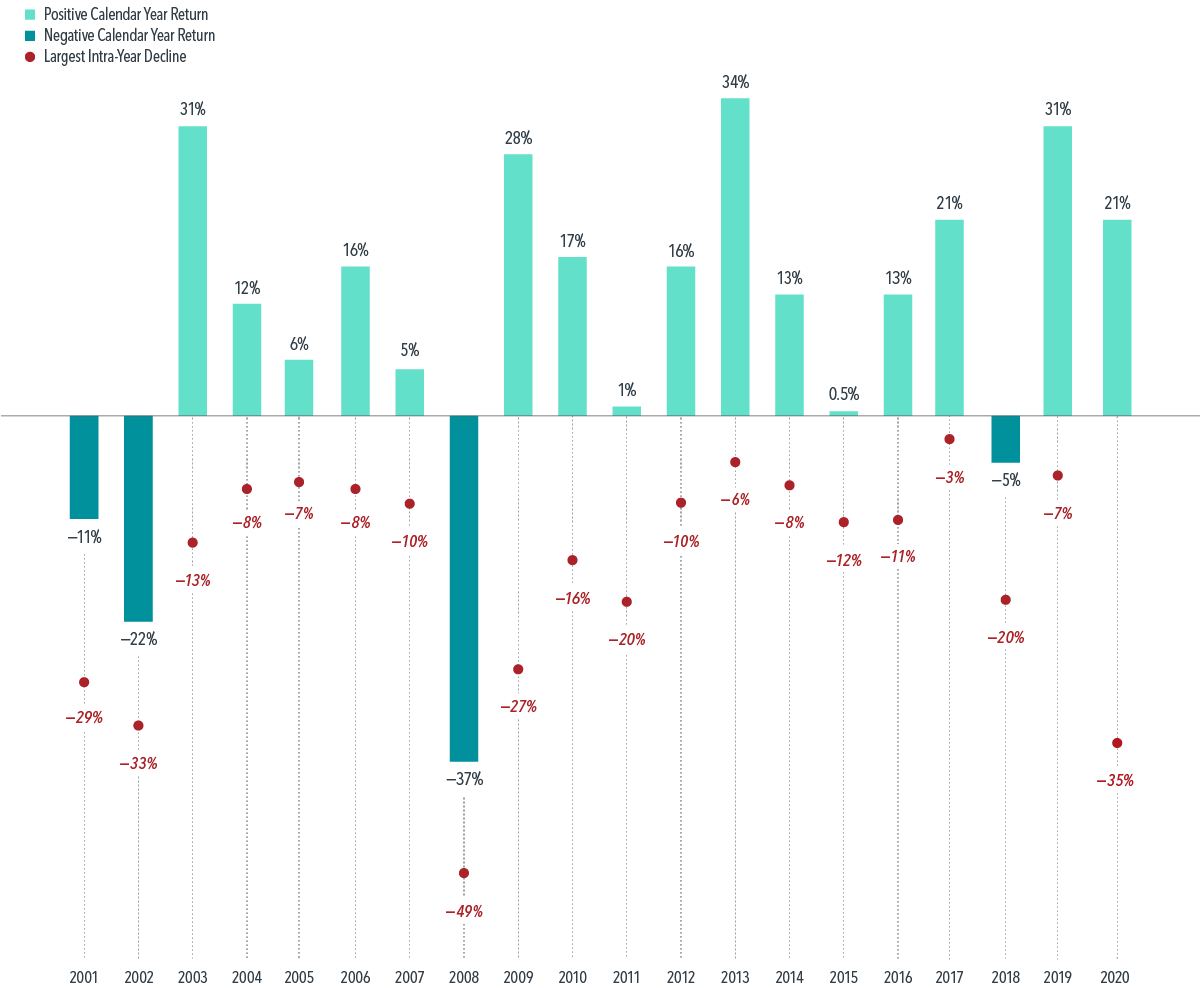
The key point to remember is the fear of adverse effects of inflation and myriads of other factors should not drive one’s long-term investment goals. Just because talking heads on tv and the media talk about inflation or the market is down continuously for a few days , does not mean its time to sell everything and sit out the market in cash. Even where this high volatility and sharp intra-year declines, markets can end with a positive return for the year. In the past 20 years there were many declines in the US market. But according to an article at Dimensional Fund Advisors, despite those downturns a broad index for the US equity market had positive returns in 15 out of those 20 years. Though the market plunged dramatically in early 2020 due to the pandemic, the calendar year return for the year was a gain of 21%.

The following chart shows the calendar year returns and the largest intra-year declines from 2001 to 2020:

Click to enlarge

Note:

January 2001–December 2020, in US dollars. Data is calculated off rounded daily returns. US Market is represented by the Russell 3000 Index. Largest Intra-Year Decline refers to the largest market decrease from peak to trough during the year. Frank Russell Company is the source and owner of the trademarks, service marks, and copyrights related to the Russell Indexes.

Source: Do Downturns Lead to Down Years?, Dimensional Fund Advisors

To take this strategy further, it is unwise to try to time the market. For most retail investors its next to impossible to sell stocks during market declines and try to back them back again at the trough.

Volatility is not abnormal in the equity market. In fact, volatility can help build a healthy market.

Update:

The following chart shows the S& 500 Full Year Returns and Intra-day declines from 2000 to 2019:

Click to enlarge

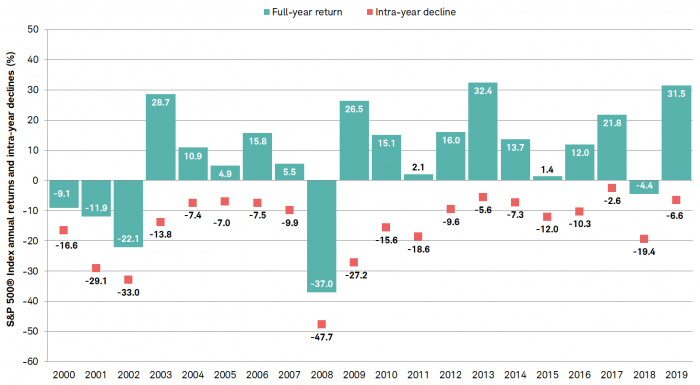
The author of the below article noted: “Figure 1: Stock market corrections are fairly common. Pullbacks of 10% or more occurred in 11 of the past 20 years.”

Source: Market Corrections Are More Common Than You Might Think, Schwab

Related ETFs:

  • SPDR S&P 500 ETF (SPY)
  • PDR Dow Jones Wilshire Mid Cap ETF (EMM)
  • SPDR S&P 400 Mid Cap Growth ETF (MDYG)
  • Vanguard Mid-Cap ETF (VO)
  • Vanguard Mid-Cap Growth ETF (VOT)
  • Vanguard S&P Mid-Cap 400 ETF (IVOO)
  • Vanguard S&P Mid-Cap 400 Growth ETF (IVOG)
Disclosure: No Positions

Dividend Yields for Select Countries 2021

Dividend yields of equity markets are generally higher in countries of the US. This is true especially in developed Europe where the dividend culture is more traditional and deep-rooted. Some emerging markets also offer attractive dividend yields. For income investors based in the US, the smart strategy is identify these opportunities abroad and spread their assets across countries and industries to capture higher yields. Currently the S&P 500 has a dividend yield of 1.38%.  Certain sectors such as utilities, consumer staples, etc. offer higher yields around 3% or so. However the maximum yields of these sectors is still lower than yields in some developed markets such as Australia, Singapore and UK for example. Even with any applicable dividend withholding taxes, ADR fees, foreign exchange impacts, etc. it is possible to earn higher yields than in the US.

The following chart shows the MSCI dividend yields for select countries and the interest rates on 10-year government bond as of Dec, 2020:

Click to enlarge

Source:  Alliance Global Investors Dividend Report 2021 via the Corner

Among the developed European countries, traditional dividend champion UK is at the top followed Norway. Spain is projected to the top dividend payer this year. Of the BRIC countries, Russia has the highest yield while India has the lowest. As noted earlier Singapore is also far ahead of many other countries including neighboring Malaysia. In the beginning of 2021, the US dividend yield based on MSCI indices stood between Ireland and Philippines.

With that said, investors looking for foreign dividend stocks can consider the following options for further research and investment:

1.Company: National Grid PLC (NGG)
Current Dividend Yield: 8.46%
Sector: Multi-Utilities
Country: UK

2.Company:Commonwealth Bank of Australia (CMWAY)
Current Dividend Yield: 2.40$
Sector: Banking
Country: Australia

3.Company: Westpac Banking Corp (WBK)
Current Dividend Yield: 3.42%
Sector: Banking
Country: Australia

4.Company: Enbridge Inc. (ENB)
Current Dividend Yield: 6.93%
Sector: Oil & Gas
Country: Canada

5.Company: DBS Group Holdings Ltd(DBSDY)
Current Dividend Yield: 2.46%
Sector: Banking
Country: Singapore

6.Company: Eni SpA (E)
Current Dividend Yield: 3.57%
Sector: Oil and Gas
Country: Italy

7.Company: TELUS Corp (TU)
Current Dividend Yield: 4.70%
Sector: Telecom
Country: Canada

8.Company: TotalEnergies SE (TTE)
Current Dividend Yield:
Sector: Oil, Gas & Consumable Fuels
Country: France

9.Company:  NK Lukoil PAO(LUKOY)
Current Dividend Yield: 9.41%
Sector: Oil & Gas – Integrated
Country: Russia

10.Company: Unilever PLC (UL)
Current Dividend Yield: 3.33%
Sector: Food Products
Country: UK

Disclosure: Long WBK

A Review of the Economy of Mexico

The economy of Mexico is the 11the largest in the world at about $2.4 Trillion. The Mexican economy is closely integrated with the economies of the US and Canada due to USMCA (previously NAFTA). According to the CIA’s World Factbook, Mexico has free trade agreements with 46 countries. The country is the second largest export market for the US and is also the third largest source of imports. The major sectors of the economy are services, industry and agriculture. Agriculture accounts for just under 3.5% of GDP.

Select Indicators for Mexico:

Source: OECD

Unlike in the past, the manufacturing sector has experience tremendous growth in the past few decades. Automobile and other manufactured goods export account for over 50% of Mexican exports as shown in the graphic below:

Click to enlarge


Source: Is Mexico’s President a Threat to Its Democracy?, WSJ

Mexico continues to attract foreign capital especially in the automotive and tech sector due to its close proximity to the US and growth of near-shoring by American and foreign manufacturers. Despite all the positive factors,  the country is plagued by corruption, high inequality and violence unleashed by the powerful drug cartels. So the flow of migrants into the US is unlikely to stop for the foreseeable future.

U.S. Banks vs. European Banks – Equity Performance Gap Since 2007

European bank stocks are recovering after a decade of disastrous performance. While US banks have recovered from the Global Financial Crisis(GFC) and also the Covid pandemic, banks from Europe barely survived. In addition to these, some of the other factors that crushed European lenders include the many years and iterations of sovereign debt crisis, money laundering scandals, the Great British Brexit saga, uncovering of outright frauds, lack of profitability, inefficient operations, etc. Even pretty basic things like maintaining 24×7 services seem to be a herculean challenge for British banks. It is not uncommon for British lenders to have technical outages for all kinds of silly reasons. Across the continent, many of the lenders maintain thousands of loss-making retail branches as if most customers do not have a computer, internet or a cell phone. Countries like France and Spain are dotted with thousands of such branches.

The following chart from a recent Bloomberg article shows the Atlantic size gap between American and European banks in terms of performance since 2007:

Click to enlarge


Source: European Bank Stocks Lead Rally After a Decade of Disappointment, Bloomberg

The full article is worth a read.


The Top 30 Stocks in the S&P 500 over the Past 30 Years

I came across the below list showing the top 30 stocks in the S&P 500 index in terms of annual returns over the past 30 years from May 1991 thru May 2021. The best stock during this time period was Netflix(NFLX) with an annualized return of over 38%. Though it is interesting to review this list and marvel at the astonishing wealth that could have been built, it is not that easy to say the least. For one thing, this chart does not show all the trials and tribulations and investors have had to go thru during these years where some of these stocks plunged dramatically. From Netflix to Amazon(AMZN) to Apple(AAPL) and a few other tech stocks in this list fell 50% or more during the period and then recovered. Not many investors may have had the courage and patience to wait out such losses.

Click to enlarge


Source: The Ultimate Superpower in Investing by Charlie Bilello, Compound Advisors

It should noted that all the tech stocks listed above benefitted from the dot com boom and the semiconductor stocks got a boost in recent years due to the pandemic, chip shortage, crypto craze, etc. It is unlikely these combination of events would emerge again in the future.

Similarly one-hit wonders such as Monster Beverage(MNST) are an anomaly. A few years ago when energy drinks turned into a fad the company’s stock skyrocketed.

Disclosure: No positions