The S&P 500 is up about 13% so far this year. In the first quarter US equity markets had a smooth sailing. However volatility returned in the second quarter with last week had four down days in a row. Fear of rising interest rates and inflation caused market participants to evaluate the strength of the current economic recovery and the headwinds stocks will face moving forward.
It is too early to confirm if inflation will continue to linger for many months and the inflation rate will head even higher. The Fed has stated it is transitory. There are signs that inflation could decline, if not totally disappear. For example, a few days ago the journal reported that lumber prices are down 41% from the recent record. This should have a positive impact on housing prices though it may take a few months. Similarly prices of menu items at restaurants could decline as labor supply increases with many states cutting down unemployment benefits.
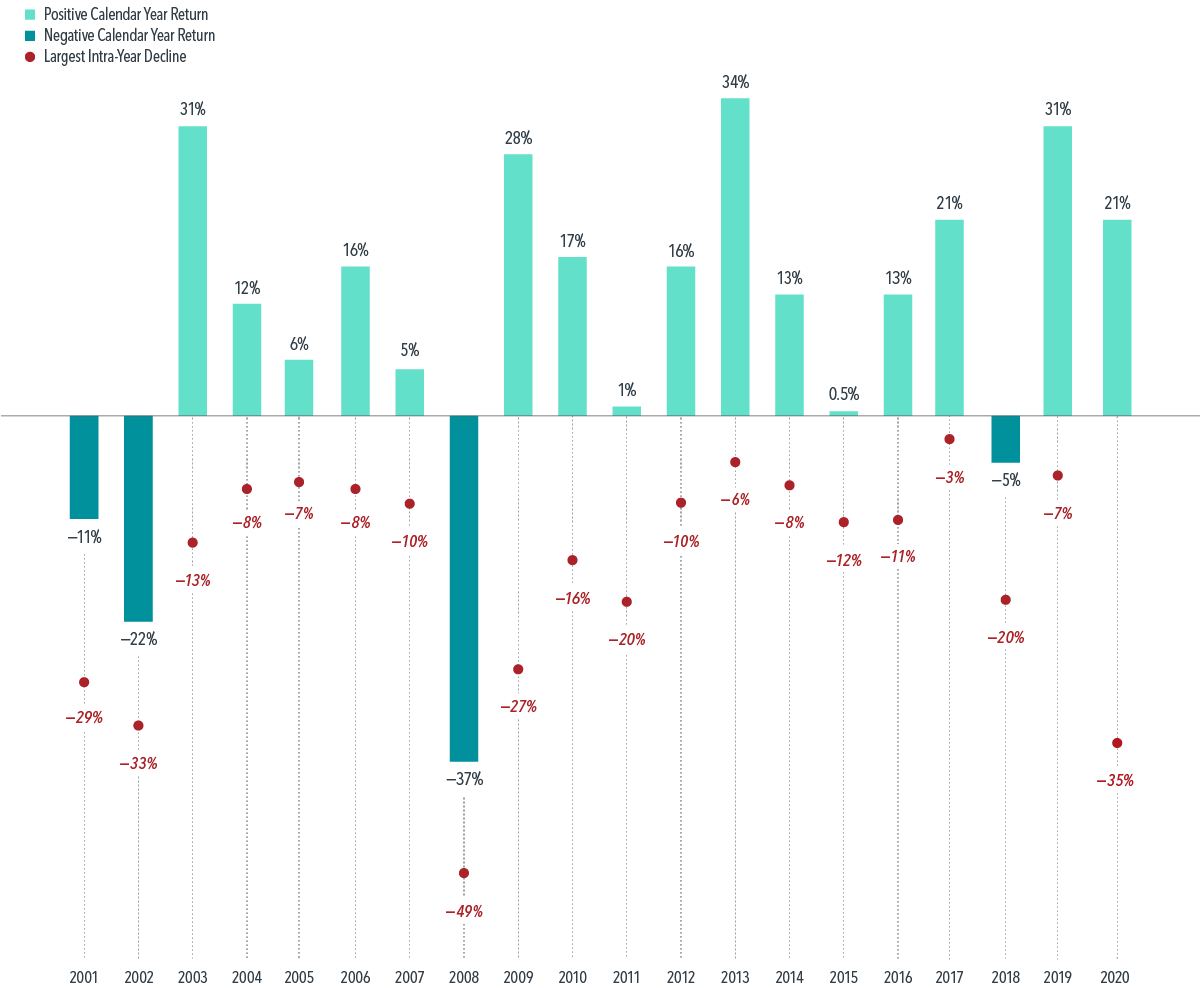
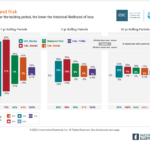
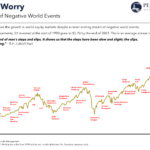
The key point to remember is the fear of adverse effects of inflation and myriads of other factors should not drive one’s long-term investment goals. Just because talking heads on tv and the media talk about inflation or the market is down continuously for a few days , does not mean its time to sell everything and sit out the market in cash. Even where this high volatility and sharp intra-year declines, markets can end with a positive return for the year. In the past 20 years there were many declines in the US market. But according to an article at Dimensional Fund Advisors, despite those downturns a broad index for the US equity market had positive returns in 15 out of those 20 years. Though the market plunged dramatically in early 2020 due to the pandemic, the calendar year return for the year was a gain of 21%.
The following chart shows the calendar year returns and the largest intra-year declines from 2001 to 2020:
Click to enlarge
Note:
January 2001–December 2020, in US dollars. Data is calculated off rounded daily returns. US Market is represented by the Russell 3000 Index. Largest Intra-Year Decline refers to the largest market decrease from peak to trough during the year. Frank Russell Company is the source and owner of the trademarks, service marks, and copyrights related to the Russell Indexes.
Source: Do Downturns Lead to Down Years?, Dimensional Fund Advisors
To take this strategy further, it is unwise to try to time the market. For most retail investors its next to impossible to sell stocks during market declines and try to back them back again at the trough.
Volatility is not abnormal in the equity market. In fact, volatility can help build a healthy market.
Update:
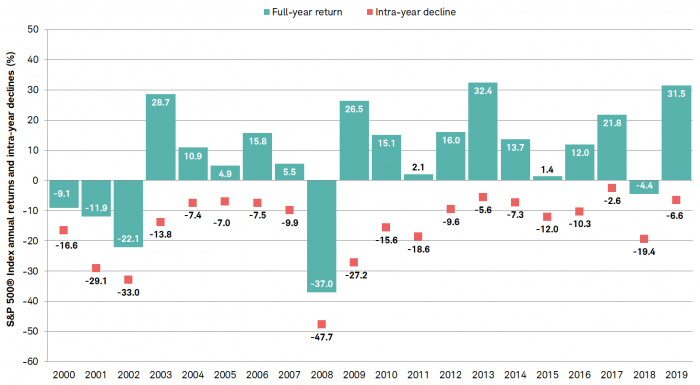
The following chart shows the S& 500 Full Year Returns and Intra-day declines from 2000 to 2019:
Click to enlarge
The author of the below article noted: “Figure 1: Stock market corrections are fairly common. Pullbacks of 10% or more occurred in 11 of the past 20 years.”
Source: Market Corrections Are More Common Than You Might Think, Schwab
Related ETFs:
- SPDR S&P 500 ETF (SPY)
- PDR Dow Jones Wilshire Mid Cap ETF (EMM)
- SPDR S&P 400 Mid Cap Growth ETF (MDYG)
- Vanguard Mid-Cap ETF (VO)
- Vanguard Mid-Cap Growth ETF (VOT)
- Vanguard S&P Mid-Cap 400 ETF (IVOO)
- Vanguard S&P Mid-Cap 400 Growth ETF (IVOG)
