The Global Top 100 Non-Financial Trans-National Corporations (TNCs) ranked by Foreign Assets as of 2013 are
listed in the table below:
| Rank | Corporation | Country | Industry | Foreign Assets (in Millions of dollars) | Total Assets (in Millions of dollars) |
|---|---|---|---|---|---|
| 1 | General Electric Co | United States | Electrical & electronic equipment | 331 160 | 656 560 |
| 2 | Royal Dutch Shell plc | United Kingdom | Petroleum expl./ref./distr. | 301 898 | 357 512 |
| 3 | Toyota Motor Corporation | Japan | Motor vehicles | 274 380 | 403 088 |
| 4 | Exxon Mobil Corporation | United States | Petroleum expl./ref./distr. | 231 033 | 346 808 |
| 5 | Total SA | France | Petroleum expl./ref./distr. | 226 717 | 238 870 |
| 6 | BP plc | United Kingdom | Petroleum expl./ref./distr. | 202 899 | 305 690 |
| 7 | Vodafone Group Plc | United Kingdom | Telecommunications | 182 837 | 202 763 |
| 8 | Volkswagen Group | Germany | Motor vehicles | 176 656 | 446 555 |
| 9 | Chevron Corporation | United States | Petroleum expl./ref./distr. | 175 736 | 253 753 |
| 10 | Eni SpA | Italy | Petroleum expl./ref./distr. | 141 021 | 190 125 |
| 11 | Enel SpA | Italy | Electricity, gas and water | 140 396 | 226 006 |
| 12 | Glencore Xstrata PLC | Switzerland | Mining & quarrying | 135 080 | 154 932 |
| 13 | Anheuser-Busch InBev NV | Belgium | Food, beverages and tobacco | 134 549 | 141 666 |
| 14 | EDF SA | France | Utilities (Electricity, gas and water) | 130 161 | 353 574 |
| 15 | Nestlé SA | Switzerland | Food, beverages and tobacco | 124 730 | 129 969 |
| 16 | E.ON AG | Germany | Utilities (Electricity, gas and water) | 124 429 | 179 988 |
| 17 | GDF Suez | France | Utilities (Electricity, gas and water) | 121 402 | 219 759 |
| 18 | Deutsche Telekom AG | Germany | Telecommunications | 120 350 | 162 671 |
| 19 | Apple Computer Inc | United States | Electrical & electronic equipment | 119 918 | 207 000 |
| 20 | Honda Motor Co Ltd | Japan | Motor vehicles | 118 476 | 151 965 |
| 21 | Mitsubishi Corporation | Japan | Wholesale trade | 112 762 | 148 752 |
| 22 | Siemens AG | Germany | Electrical & electronic equipment | 110 462 | 137 863 |
| 23 | ArcelorMittal | Luxembourg | Metal and metal products | 109 602 | 112 308 |
| 24 | Iberdrola SA | Spain | Utilities (Electricity, gas and water) | 108 679 | 127 235 |
| 25 | Johnson & Johnson | United States | Pharmaceuticals | 96 803 | 132 683 |
| 26 | Nissan Motor Co Ltd | Japan | Motor vehicles | 95 228 | 143 029 |
| 27 | Hutchison Whampoa Limited | Hong Kong, China | Diversified | 91 436 | 105 169 |
| 28 | Fiat S.p.A. | Italy | Motor vehicles | 90 985 | 119 474 |
| 29 | Pfizer Inc | United States | Pharmaceuticals | 90 403 | 172 101 |
| 30 | BMW AG | Germany | Motor vehicles | 88 370 | 190 511 |
| 31 | Wal-Mart Stores Inc | United States | Retail & Trade | 88 206 | 204 751 |
| 32 | Daimler AG | Germany | Motor vehicles | 87 257 | 232 023 |
| 33 | Telefonica SA | Spain | Telecommunications | 87 156 | 163 654 |
| 34 | Mitsui & Co Ltd | Japan | Wholesale trade | 86 023 | 107 016 |
| 35 | Ford Motor Company | United States | Motor vehicles | 79 092 | 203 752 |
| 36 | CITIC Group | China | Diversified | 78 602 | 565 884 |
| 37 | Statoil ASA | Norway | Petroleum expl./ref./distr. | 78 185 | 144 741 |
| 38 | Airbus Group NV | France | Aircraft | 77 614 | 128 474 |
| 39 | Novartis AG | Switzerland | Pharmaceuticals | 71 941 | 126 254 |
| 40 | Procter & Gamble Co | United States | Diversified | 70 981 | 139 263 |
| 41 | Hon Hai Precision Industries | Taiwan Province of China | Electrical & electronic equipment | 70 659 | 77 089 |
| 42 | General Motors Co | United States | Motor vehicles | 70 074 | 166 344 |
| 43 | Anglo American plc | United Kingdom | Mining & quarrying | 68 955 | 71 165 |
| 44 | BHP Billiton Group Ltd | Australia | Mining & quarrying | 67 649 | 139 178 |
| 45 | Repsol YPF SA | Spain | Petroleum expl./ref./distr. | 66 011 | 89 613 |
| 46 | International Business Machines Corporation | United States | Electrical & electronic equipment | 60 841 | 126 223 |
| 47 | BASF SE | Germany | Chemicals | 58 323 | 88 644 |
| 48 | Rio Tinto PLC | United Kingdom | Mining & quarrying | 58 059 | 111 025 |
| 49 | Microsoft Corporation | United States | Prepackaged software | 57 087 | 142 431 |
| 50 | Unilever PLC | United Kingdom | Diversified | 55 769 | 62 664 |
| 51 | BG Group plc | United Kingdom | Oil and gas field exploration | 55 026 | 65 974 |
| 52 | Hewlett-Packard Co | United States | Electrical & electronic equipment | 54 548 | 105 676 |
| 53 | ConocoPhillips | United States | Petroleum expl./ref./distr. | 54 430 | 118 057 |
| 54 | Compagnie de Saint-Gobain SA | France | Non-metallic mineral products | 53 704 | 62 957 |
| 55 | SABMiller PLC | United Kingdom | Food, beverages and tobacco | 53 332 | 53 751 |
| 56 | Orange | France | Telecommunications | 52 362 | 118 178 |
| 57 | RWE AG | Germany | Utilities (Electricity, gas and water) | 52 336 | 111 688 |
| 58 | Roche Group | Switzerland | Pharmaceuticals | 50 837 | 67 084 |
| 59 | Mondelez International, Inc. | United States | Food, beverages and tobacco | 50 834 | 72 557 |
| 60 | Sumitomo Corporation | Japan | Wholesale trade | 49 662 | 84 326 |
| 61 | GlaxoSmithKline PLC | United Kingdom | Pharmaceuticals | 49 460 | 69 403 |
| 62 | Petronas - Petroliam Nasional Bhd | Malaysia | Petroleum expl./ref./distr. | 49 072 | 163 275 |
| 63 | AP Moller - Maersk A/S | Denmark | Transport and storage | 48 730 | 74 451 |
| 64 | Sanofi | France | Pharmaceuticals | 48 403 | 132 266 |
| 65 | Vattenfall AB | Sweden | Electricity, gas and water | 47 667 | 75 105 |
| 66 | Vale SA | Brazil | Mining & quarrying | 47 247 | 124 289 |
| 67 | Samsung Electronics Co., Ltd. | Korea, Republic of | Electrical & electronic equipment | 46 425 | 203 671 |
| 68 | Schlumberger Ltd | United States | Other consumer services | 45 507 | 67 100 |
| 69 | Imperial Tobacco Group PLC | United Kingdom | Tobacco | 45 444 | 45 872 |
| 70 | United Technologies Corporation | United States | Aircraft | 44 786 | 90 594 |
| 71 | Christian Dior SA | France | Textiles | 43 908 | 71 981 |
| 72 | Tesco PLC | United Kingdom | Retail & Trade | 43 488 | 83 565 |
| 73 | China Ocean Shipping (Group) Company | China | Transport and storage | 43 452 | 56 126 |
| 74 | Linde AG | Germany | Chemicals | 43 048 | 45 090 |
| 75 | Sony Corporation | Japan | Electrical & electronic equipment | 42 239 | 149 161 |
| 76 | British American Tobacco PLC | United Kingdom | Food, beverages and tobacco | 41 940 | 44 329 |
| 77 | Caterpillar Inc | United States | Construction | 41 526 | 84 896 |
| 78 | Lafarge SA | France | Non-metallic mineral products | 41 484 | 51 046 |
| 79 | Volvo AB | Sweden | Motor vehicles | 41 185 | 53 242 |
| 80 | Google Inc. | United States | Software | 40 916 | 110 920 |
| 81 | Renault SA | France | Motor vehicles | 40 866 | 103 252 |
| 82 | Marubeni Corporation | Japan | Wholesale trade | 40 677 | 70 578 |
| 83 | ABB Ltd. | Switzerland | Engineerig services | 39 893 | 48 064 |
| 84 | AstraZeneca PLC | United Kingdom | Pharmaceuticals | 39 700 | 55 899 |
| 85 | Liberty Global plc | United Kingdom | Telecommunications | 38 129 | 67 714 |
| 86 | Carrefour SA | France | Retail & Trade | 37 913 | 59 981 |
| 87 | OMV AG | Austria | Petroleum expl./ref./distr. | 37 282 | 43 765 |
| 88 | ITOCHU Corporation | Japan | Wholesale trade | 37 075 | 76 347 |
| 89 | Barrick Gold Corporation | Canada | Gold mining | 36 911 | 37 448 |
| 90 | The Coca-Cola Company | United States | Food, beverages and tobacco | 36 860 | 90 055 |
| 91 | Cargill | United States | Food | 35 928 | 59 880 |
| 92 | Pepsico Inc | United States | Food, beverages and tobacco | 35 863 | 77 478 |
| 93 | WPP PLC | United Kingdom | Business services | 35 649 | 41 236 |
| 94 | Deutsche Post AG | Germany | Transport and storage | 35 489 | 48 848 |
| 95 | Merck & Co | United States | Pharmaceuticals | 34 552 | 105 645 |
| 96 | Diageo PLC | United Kingdom | Food, beverages and tobacco | 34 431 | 38 157 |
| 97 | Teva Pharmaceutical Industries Limited | Israel | Pharmaceuticals | 34 376 | 47 508 |
| 98 | China National Offshore Oil Corp | China | Petroleum expl./ref./distr. | 34 276 | 129 834 |
| 99 | Japan Tobacco Inc | Japan | Food, beverages and tobacco | 34 054 | 44 858 |
| 100 | Koninklijke Philips Electronics NV | Netherlands | Electrical & electronic equipment | 33 901 | 36 568 |
Source: UNCTAD
Download Lists:
- The Global Top 100 Non-Financial Trans-National Corporations (TNCs) (in Excel format)
- The Global Top 100 TNCs from Emerging and Frontier Markets (in Excel format)
Related:
- The Top 25 Financial State-Owned Multi-National Companies 2017 , TFS
- The Top 25 Non-Financial State-Owned Multi-National Companies 2017, TFS
- The Top 100 Non-Financial TNCs from Developing and Transition Economies Ranked by Foreign Assets
- The Top 10 Non-Financial State-Owned Multi-National Companies (TFS 2015)
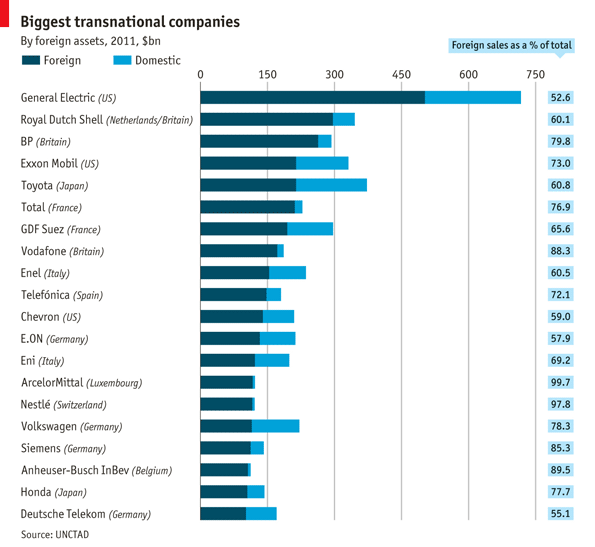 Source: Biggest transnational companies (The Economist, 2012)
- The 100 largest companies in the world ranked by revenue in 2015 (in billion U.S. dollars) (Statista)
- The Top 100 Non-Financial TNCs from Developing and Transition Economies Ranked by Foreign Assets (TFS)
- 15 Non-Financial European Companies with Large Government Ownership (TFS)
- For the latest version of this list go here: The World’s Top 100 Non-Financial MNEs by Foreign Assets 2016
- The World’s Top 100 Non-Financial TNCs Ranked by Foreign Assets 2015
From a potential investment perspective investors can consider the following ten stocks for further research:
1.Company: Johnson & Johnson (JNJ)
Current Dividend Yield: 2.68%
Country: USA
2.Company: Nestle SA (NSRGY)
Current Dividend Yield: 3.19%
Country: Switzerland
3.Company: Diageo PLC (DEO)
Current Dividend Yield: 2.89%
Country: UK
4.Company: Vodafone Group PLC (VOD)
Current Dividend Yield: 7.10%
Country: UK
5.Company: British American Tobacco PLC (BTI)
Current Dividend Yield: 4.15%
Country: UK
6.Company: Total SA (TOT)
Current Dividend Yield: 5.05%
Country: France
7.Company: BASF SE (BASFY)
Current Dividend Yield: 3.77%
Country: Germany
8.Company: Novartis AG (NVS)
Current Dividend Yield: 2.94%
Country: Switzerland
9.Company: Unilever PLC (UL)
Current Dividend Yield: 3.45%
Country: UK
10.Company: Teva Pharmaceutical Industries Limited (TEVA)
Current Dividend Yield: 2.62%
Country: Israel
Note: Dividend yields noted above are as of Sept 15, 2014. Data is known to be accurate from sources used. Please use your own due diligence before making any investment decisions.
Disclosure: No Positions
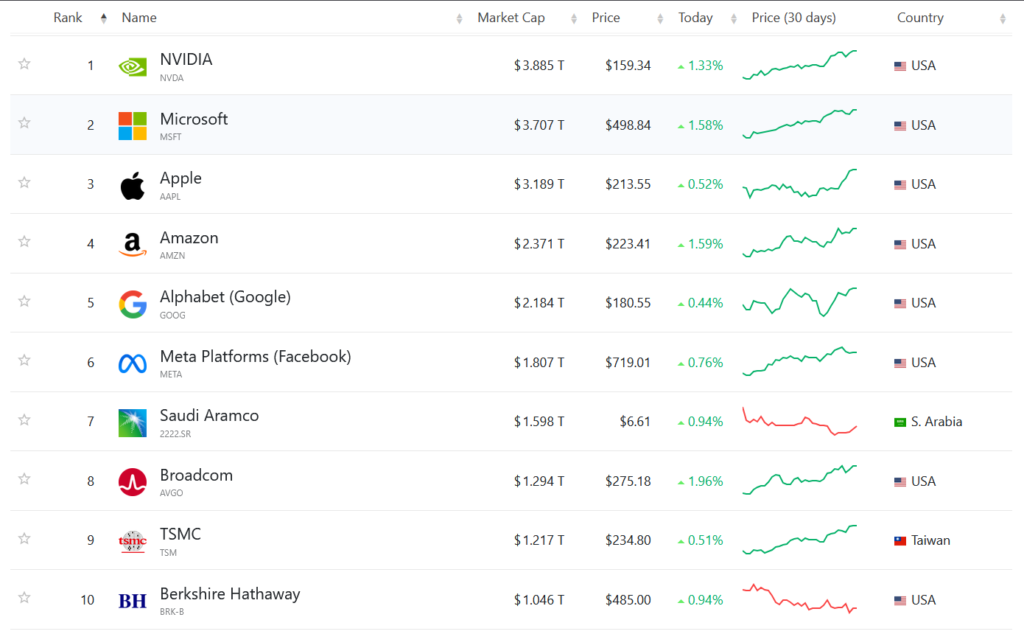
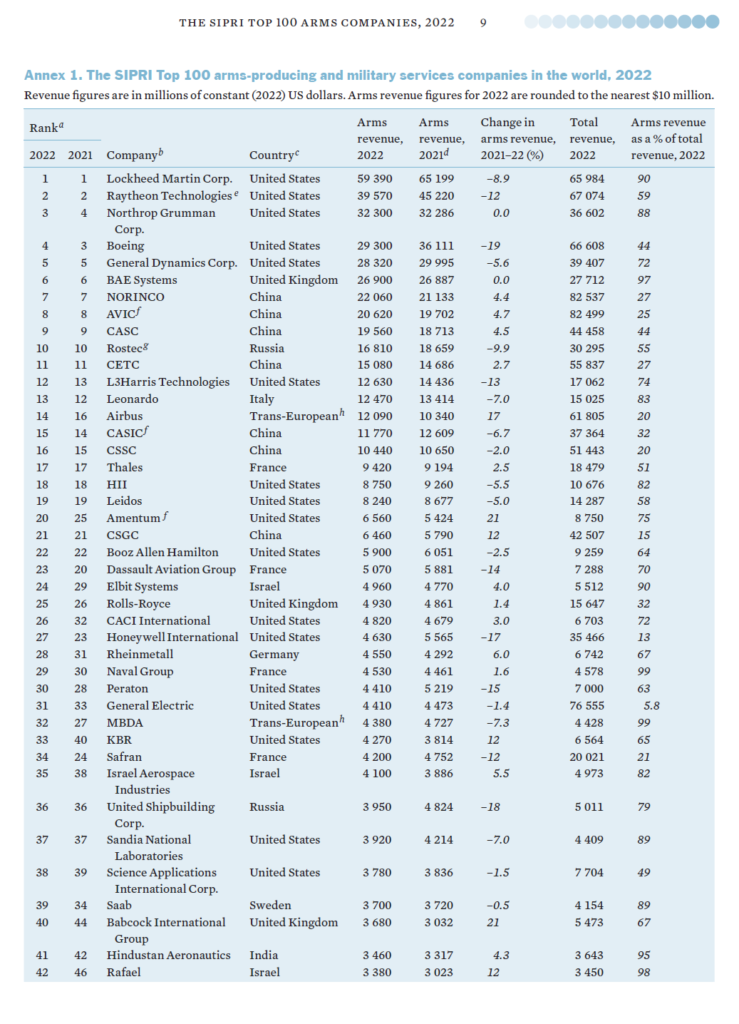
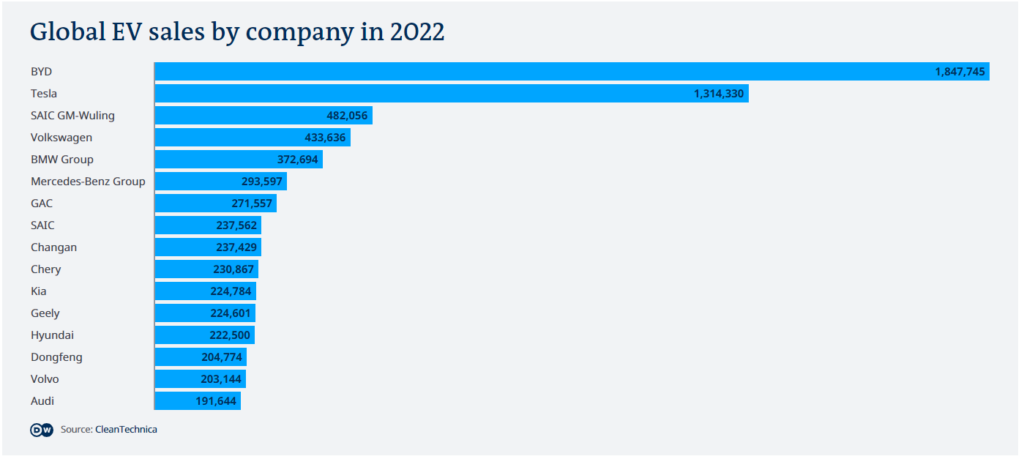
assets by company and country
Thanks for your comment.Unfortunately I do not have the info you are looking for.
EXCELLENT INFORMATION. THANKS A LOT.
CAN YOU GIVE ME THE UNCTAD PAGE YOU GOT IT?
Sure. You can click on the Source link at the bottom of the end on that page to get to the UNCTAD page.
Hope this helps.
pukka stats man
Wt r the turn over of the company
U can download the UNCTAD report for that info.