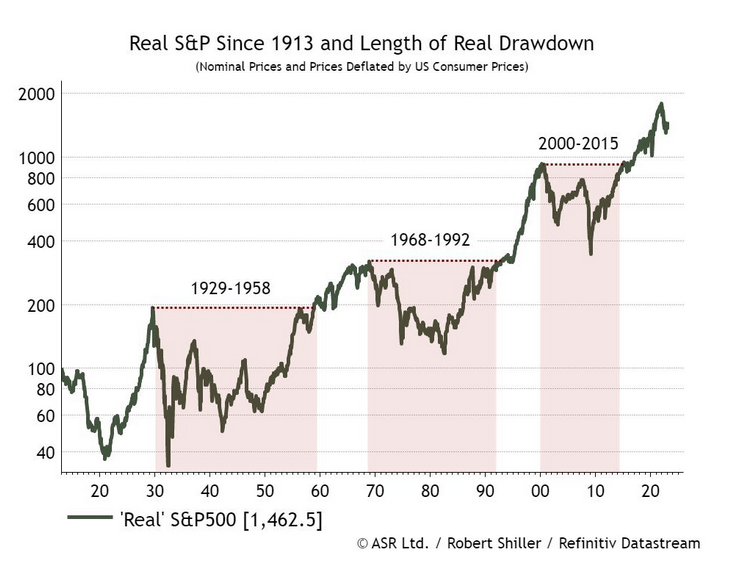
The Real Return of the S&P 500 Index which accounts for inflation over the last century is shown in the chart below. During periods of high inflation (red zones) such as from 1929 to 1958 it took over a decade to move higher than previous highs. Despite inflation, a $100 investment in 1913 would have grown to around $1,500 in 2013 – a real return of 1,400%. This shows that equities are the best asset class to beat inflation.
High inflation times are also the best times to invest. For instance, a $100 investment in the index in 1950 would have returned 2,208% by 2013.
Click to enlarge
Source: The danger of buybacks, US bankruptcies, and whistleblowers, Market Index
Related ETFs:
- SPDR S&P 500 ETF (SPY)
- iShares Core S&P 500 ETF (IVV)
- Vanguard S&P 500 ETF (VOO)
- SPDR Portfolio S&P 500 ETF (SPLG)
The Complete List of Constituents of the S&P 500 Index can be found here.
Disclosure: No positions


