Many investors focus on the price return of the S&P 500 index when they consider their investment return Instead investors ought to pay attention to the total return which includes dividends reinvested. The total return of the index can especially be much higher the price return when looking at many years. This is because of the effect of compounding.
Though the average dividend yield on the index has been around 2% for many years, the returns are amplified over the years due to compounding. The following chart shows the difference in returns over two decades:
Click to enlarge
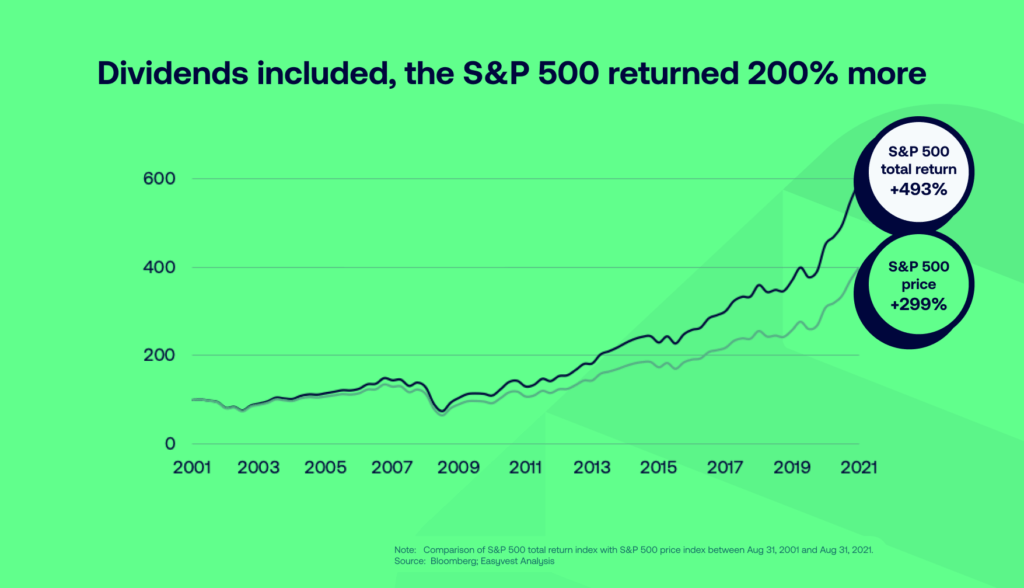
Source: Price return VS total return : don’t get confused !, Camille Van Vyve, easyvest
The key point to remember is that the gap between price and total return over short period such as one year won’t me much. For instance, the price return in 2021 for the S&P 500 was 26.9% while the total total return was 28.7%. The following chart shows the returns over ten years ending in December, 2021:
Click to enlarge
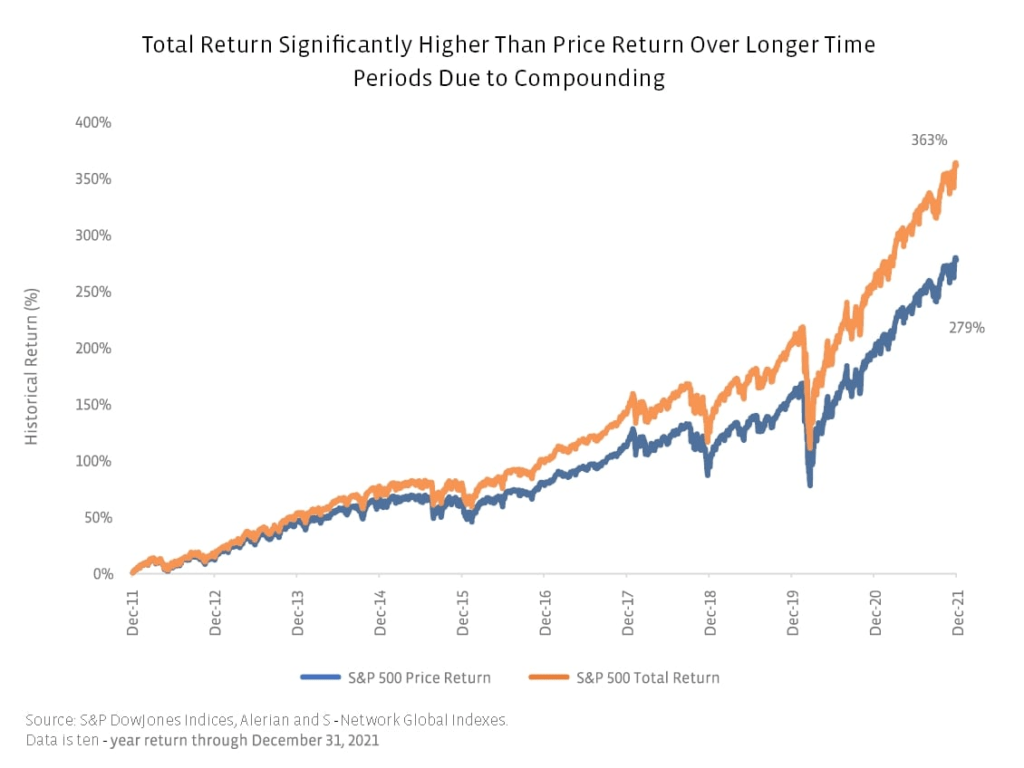
Source: Income Opportunities: Examining Price and Total Return in 2021 by Roxanna Islam, Alerian
Related ETFs:
Disclosure: No positions
