Equity markets can be volatile in the short run. But traditionally they tend go higher in the long run. That is why it is always wise to hold stocks for the long term. The following chart shows the annual total returns of the S&P 500 from 1926 to 2020. The histogram shows the number of positive years are much more than the number of years when the market was down.
Click to enlarge
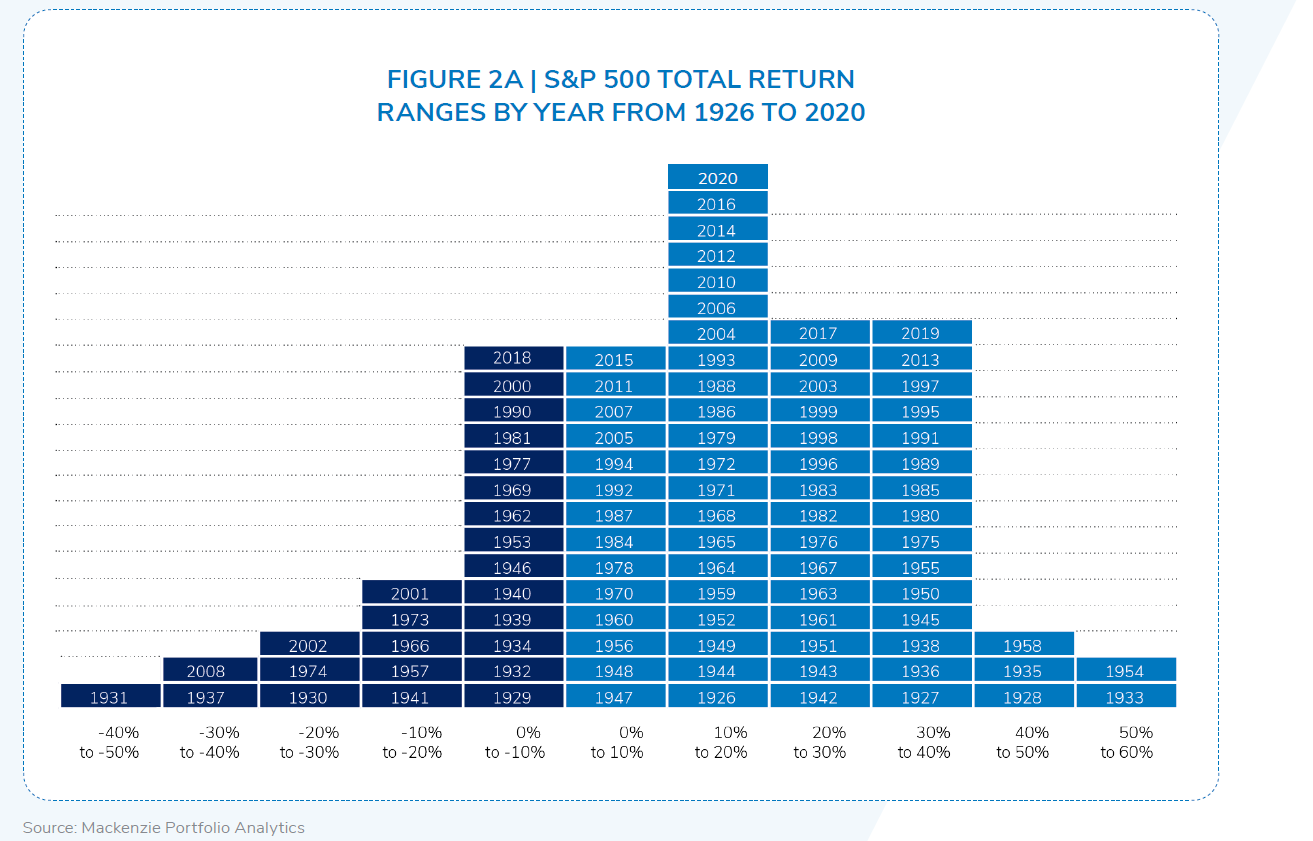
Source: Time in the market, not timing the market, is what builds wealth., IG Wealth Management
Related ETFs:
- SPDR S&P 500 ETF (SPY)
- iShares Core S&P 500 ETF (IVV)
- Vanguard S&P 500 ETF (VOO)
- SPDR Portfolio S&P 500 ETF (SPLG)
Disclosure: No positions


