One of the main factors that is important for success with investing in equities is the art of diversification and having patience. Diversification can be achieved in many ways such as spreading over one’s assets over different asset classes, countries, regions, sectors, etc. The benefits of this strategy was widely made popular with the Callan Periodic Table of Investment Returns. Many others have replicated that design and created periodic table of investment returns charts. I came across the following Periodic Table of Annual Investment Returns published by Mercer for the Australian Equity Market. This chart also clearly shows the advantages of diversification for Australian investors.
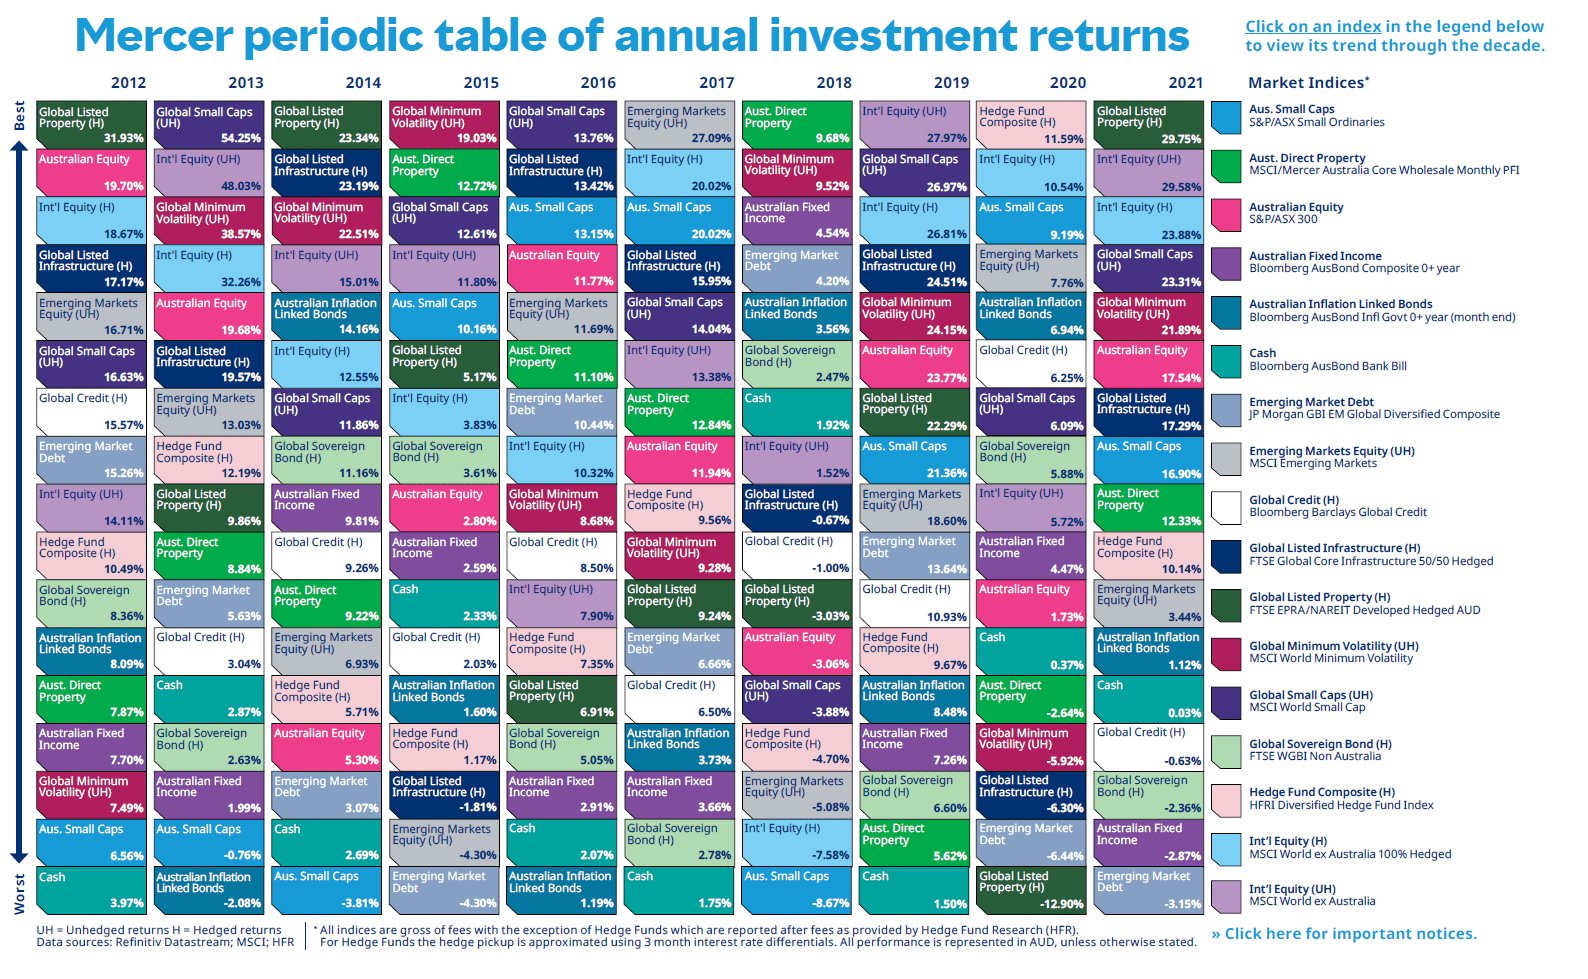
Mercer Periodic Table of Annual Investment Returns for Australian Investors 2012 To 2021:
Click to enlarge
Note: Returns quoted are based on Australian Dollars
Source: Mercer
In 2021, Australian stocks as represented by the S&P/ASX 200 index returned 17.54%. But International Equities (Hedged) performed even better and yielded 23.88%. Aussie Small Caps and Direct Property had lower returns as well.
Below are some findings from the Mercer report:
“Demystifying the Mosaic
Looking across 2021 and the past decade, a number of observations can be made from the Periodic Table:
- 13 of the 17 asset classes generated a positive return last year – bettering 2020 (12 positive returns) but not as remarkable as the 100% outcome achieved in 2019.
- Leading the way in 2021 was Global Listed Property (H) with a stellar return of 29.8%. Amidst a busy year property markets recovered. Investors sought out alternative inflation linked sources of return and the asset class delivered handsomely.
- Global Equity (UH) featured in second place in 2021 (+29.6%). The rally for the asset class continued from +4.5% in the previous year as confidence in risky assets returned post pandemic.
- International Equity (H) was another asset class that produced impressive returns in 2021, up +23.3%. Meanwhile, in a notable divergence occurred for Emerging Market Equities UH (+3.4%) and Emerging Market debt, which were far softer (-3.2%) with Turkey and China amongst the main soft spots with economic and political developments.
- Australian Equity (+17.5%) lagged other developed markets like the US which had more growth/tech exposure, as Australia relies more on traditional industries.
- Fixed income in general faced a difficult year end as inflation expectations increased, with global sovereign bonds returning -2.9% and Australian fixed income returning -3.2%.”
Source: Mercer
An interactive version of the above chart and other valuable charts can be found at their site here.
Related ETF:
- iShares MSCI Australia ETF(EWA)
Disclosure: No positions