I have written many times over the years that “time in the market” is more important than “timing the market”. This is because equity markets tend to overdo on either directions. That is markets overshoot during bull markets to astronomical levels only to decline dramatically at some point to great depths. In both directions, investors euphoria and fear drive stock prices to above-normal levels.
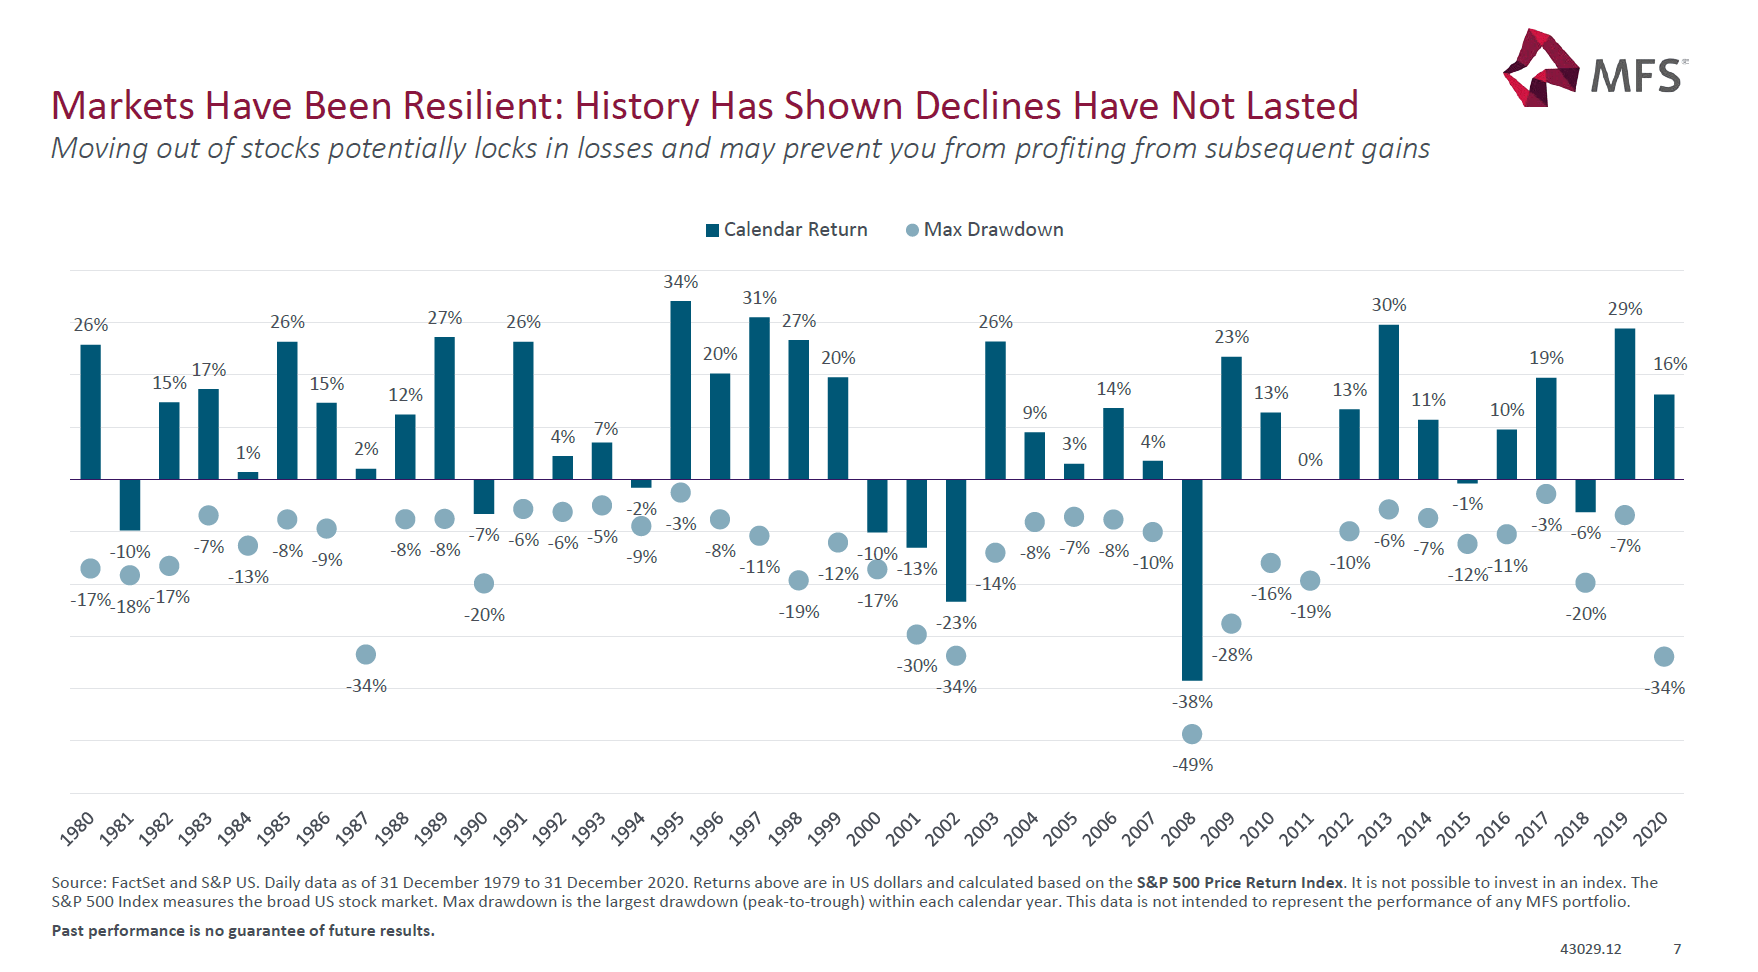
The classic example of this scenario played out last year in the US markets. In March, 2020 equities crashed as the pandemic began causing panic among investors. During the course of the next few months the S&P 500 fell by 34%. Any investor that panicked and sold at the trough would have lost big as markets turned swiftly and ended the year with a positive return of 16%.
The following chart shows the calendar year returns and the intra-year maximum declines for the S&P 500 price index from 1980 to 2020:
Click to enlarge
Source: Principles of Long-Term Investing Resilience, MFS
Even during the Global Financial Crisis (GFC) of 2008-09, S&P 500 collapsed by about 50% by the return for the year was a loss of 38%. In the following year, the index shot up by 23%.
Related ETFs:
- SPDR S&P 500 ETF (SPY)
Disclosure: No positions
