The distribution of US equity returns based on total returns from 1825 to 2020 is shown in the chart below. Many studies have proven that over the long-term equities tend to yield a positive return than a negative return. The chart below confirms that as well. The only time US stocks as represented by the S&P 500 (its predecessor index to be more precise) plunged by forty to fifty percent was in 1931 during the Great Depression. More recently during the Great Financial Crisis ((GFC) of 2008-2009 equities fell by thirty to forty percent. Overall up years are more than down years.
Click to enlarge
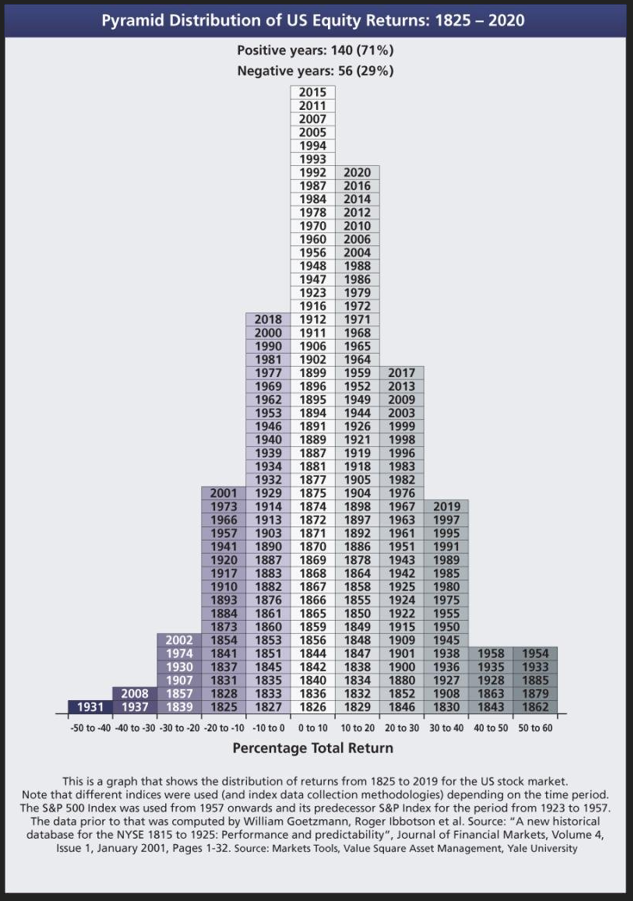
Source: via Cannon Asset Managers Twitter
It should be noted however that nobody is going to own stocks for over 100 years. However holding for a few decades is definitely a smart move even account for any bear markets in between. This is because severe bear market declines are usually followed by sharp and dramatic increase in stock prices which eventually become the start of a bull market.
Related ETFs:
- SPDR S&P 500 ETF (SPY)
- S&P MidCap 400 SPDR ETF (MDY)
- SPDR Consumer Discretionary Select Sector SPDR Fund (XLY)
- SPDR Consumer Staples Select Sector SPDR Fund (XLP)
- SPDR Energy Select Sector SPDR Fund (XLE)
- SPDR Financials Select Sector SPDR Fund (XLF)
- iShares Dow Jones Select Dividend ETF (DVY)
- SPDR S&P Dividend ETF (SDY)
- Vanguard Dividend Appreciation ETF (VIG)
Disclosure: No positions


