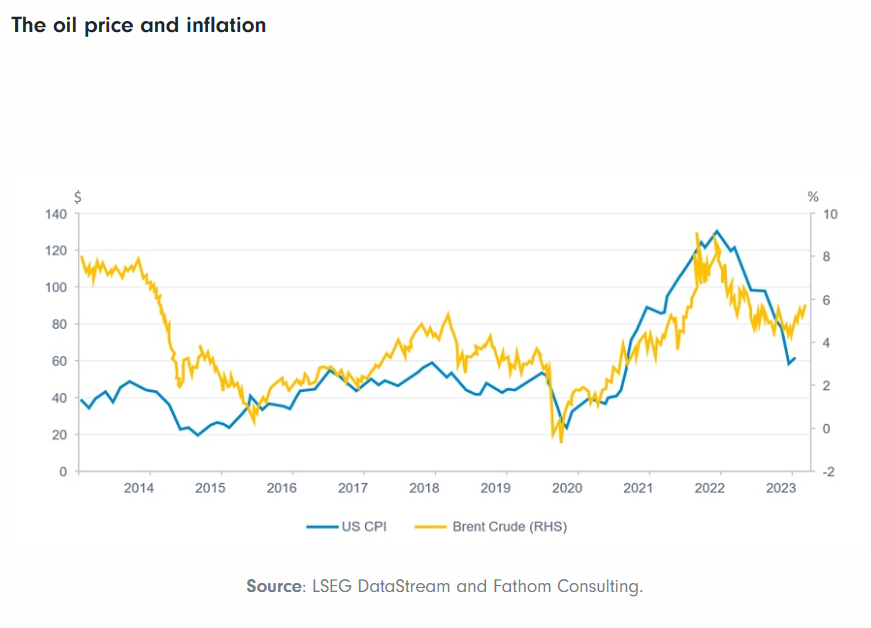
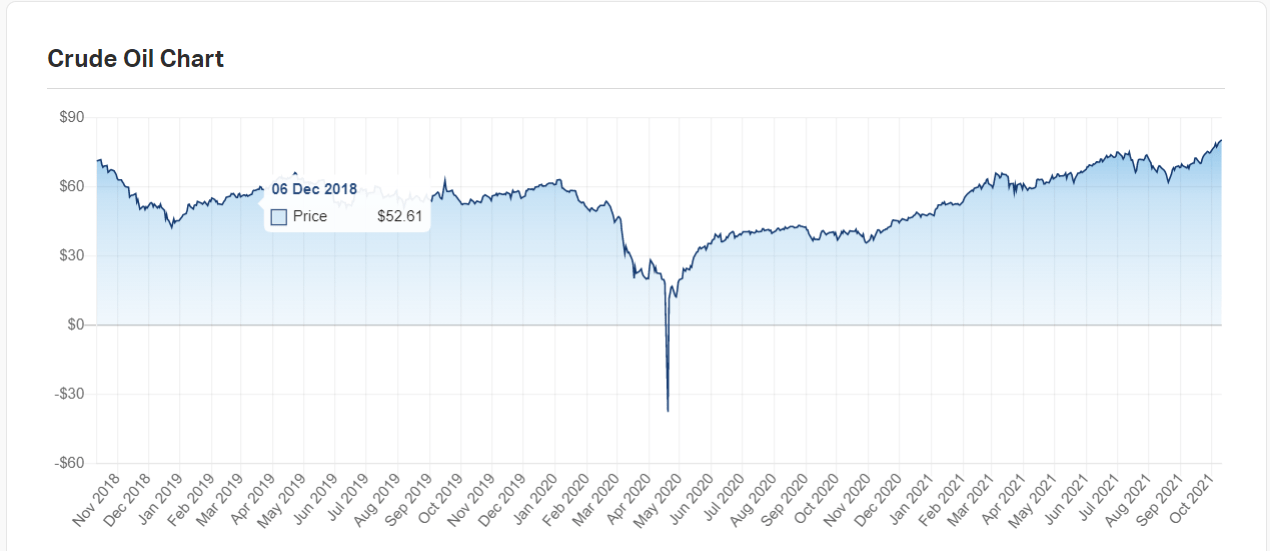
Crude oil prices have been rising for a few months now and US crude price per barrel crossed $80.0 yesterday for the first time since 2014. Oil prices have soared by 125% since the end of last October. Higher crude oil prices lead to higher gas prices which then causes sticker shock to Americans. Gas prices are over $3.25 per gallon in some places in the country. It remains to be seen if oil prices could reach $100 per barrel. With that said below are two charts on oil prices
1.Crude Oil Prices since November 2018:
Click to enlarge
2.Historical Chart of WTI and Brent Crude Prices since 1980:
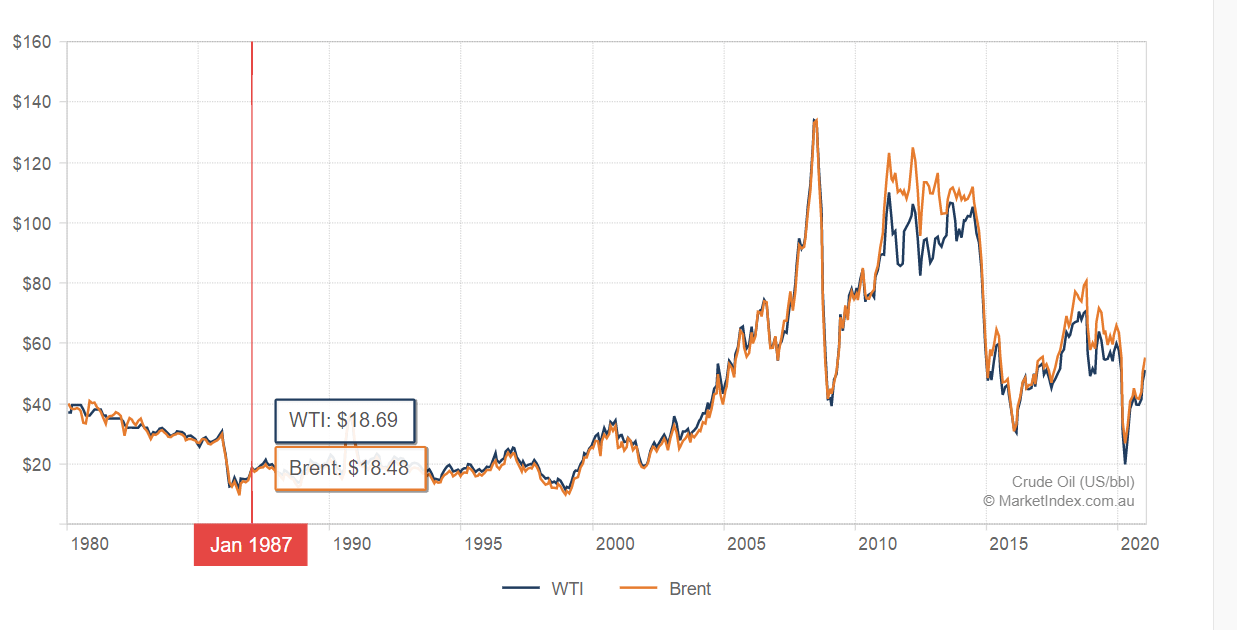
Source: Crude Oil, Market Index
Related ETF:
- United States Oil ETF (USO)
Oil Stock Lists:
- The Complete List of Integrated Oil Companies Stocks Trading on the NYSE
- The Complete List of Integrated Oil Stocks Trading on NASDAQ
- The Complete List of Oil and Gas Producers Stocks Trading on NASDAQ
- The Complete List of Oil and Gas Producers Trading on the NYSE
Disclosure: No Positions