The Andex Chart shows the performance of various asset classes for the Australian market over the long term. This powerful chart contains other fascinating details like annual returns, political leadership, etc. A $100 (Australian $) investment in 1950 would have grown to A$260,786 by 2021 or at about 11.7% per year. Some of the major global and Australian events are noted in the chart as well.
You can view the chart at Andex Charts Pty Ltd
Related:
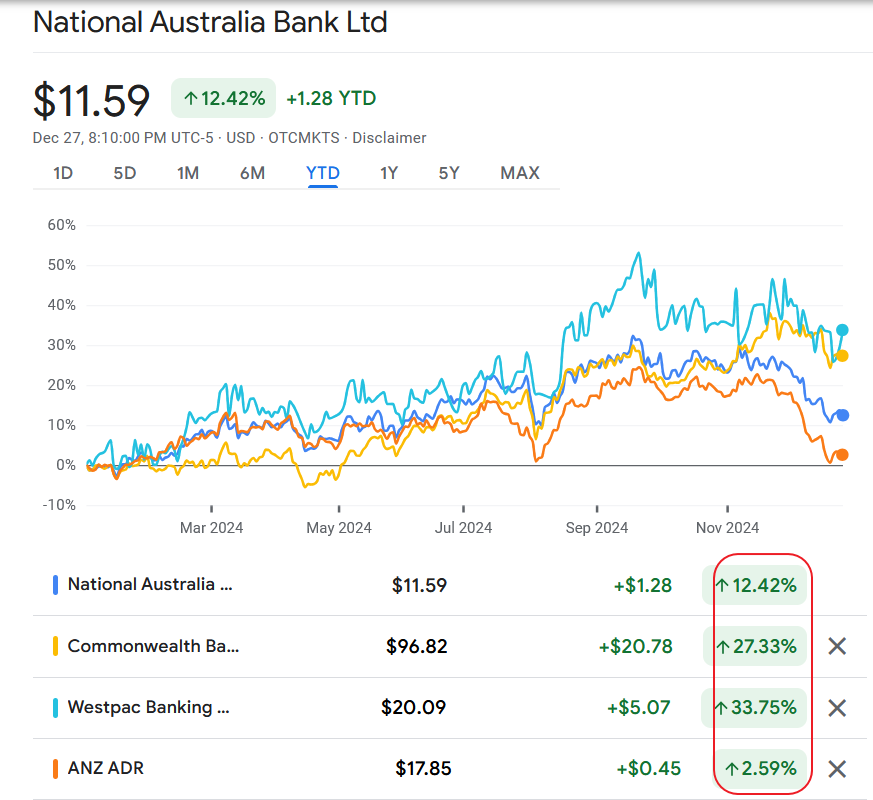
- The Complete List of Australian ADRs
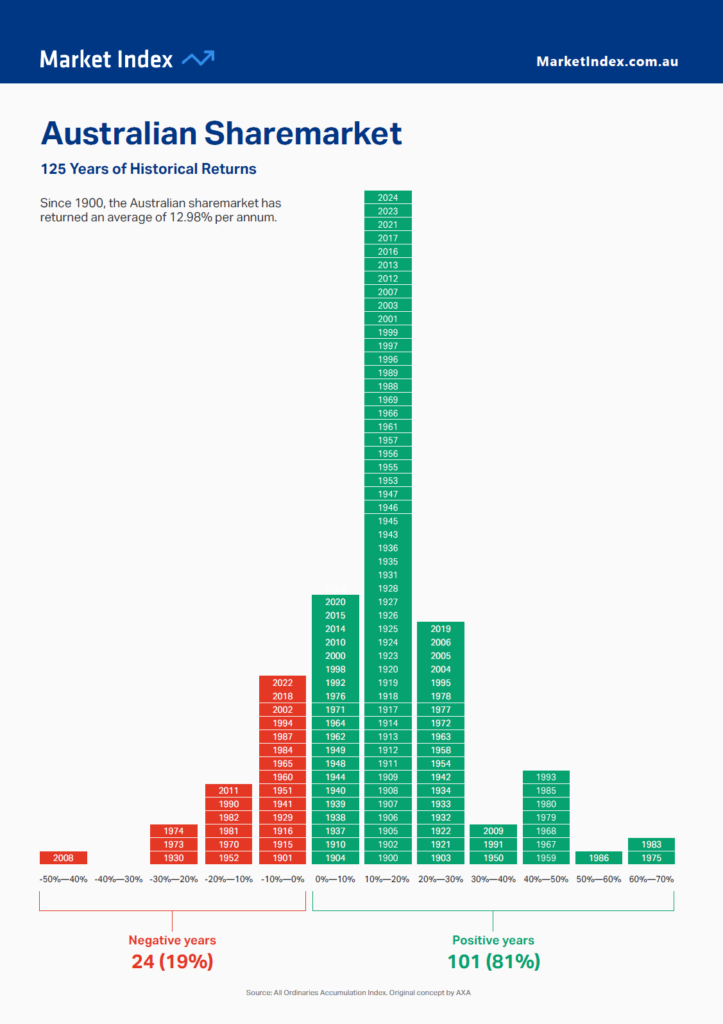
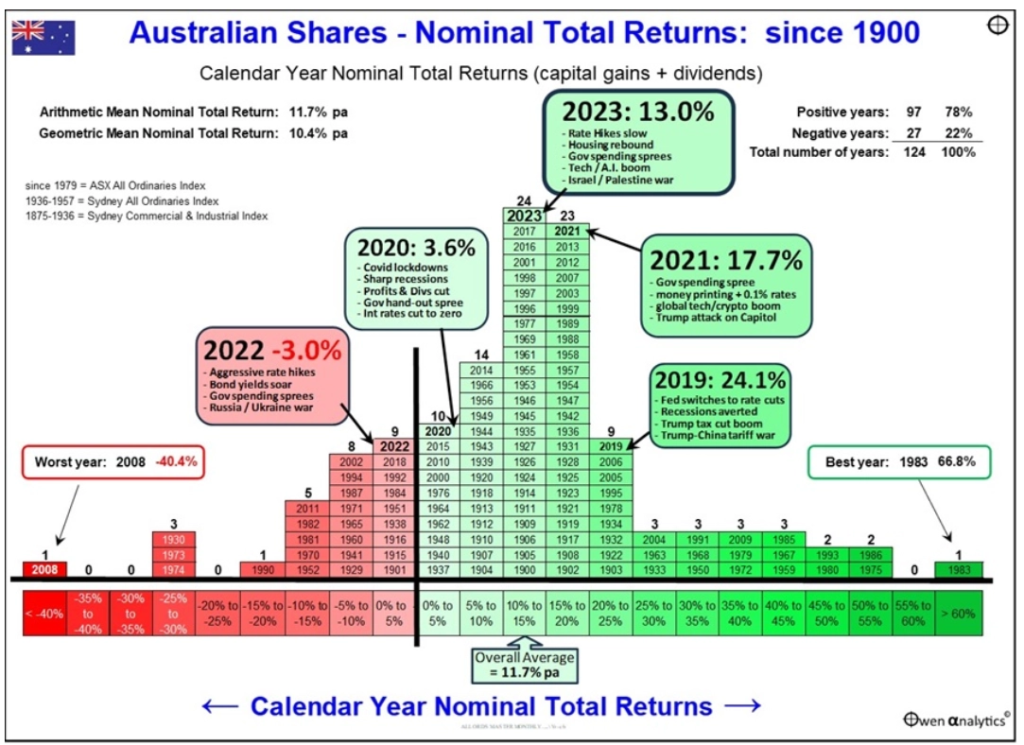
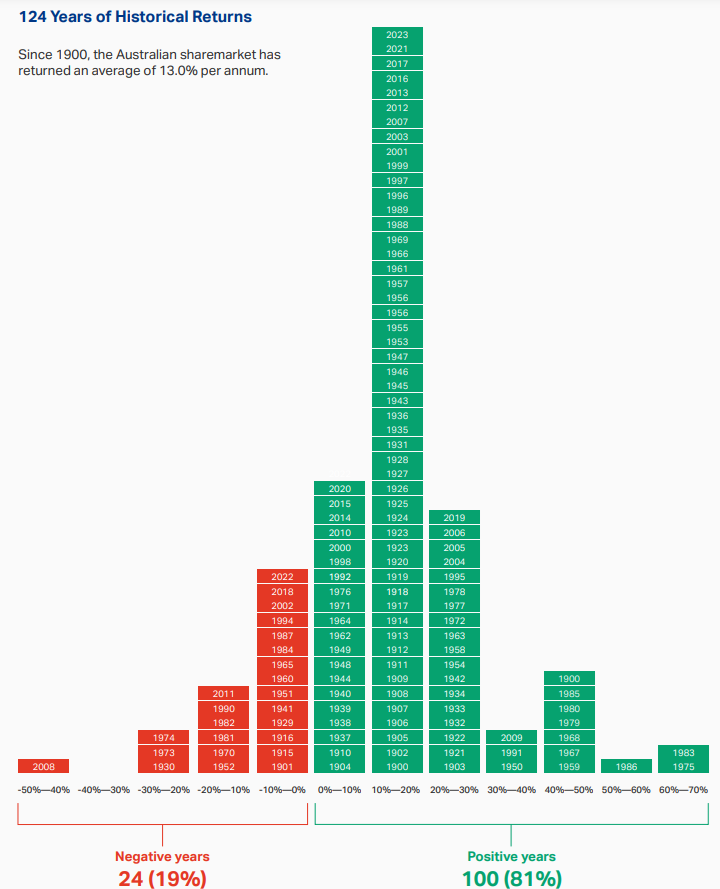
- The Historical Average Annual Returns of Australian Stock Market Since 1900
Related Andex Charts for other markets: