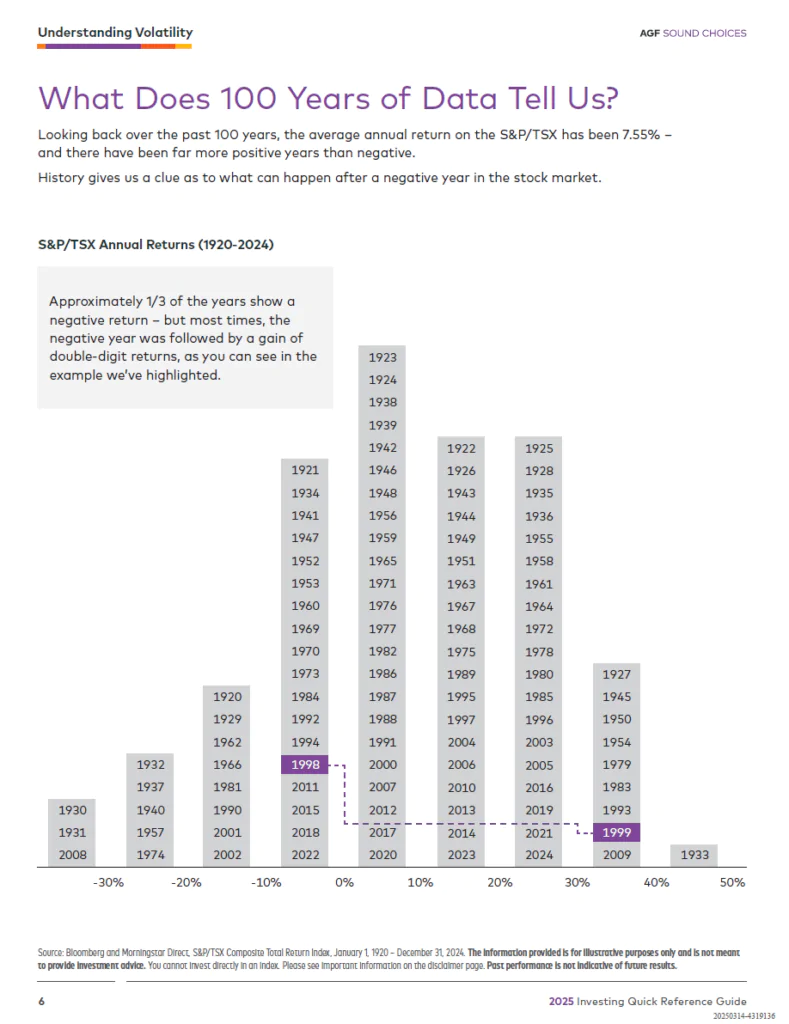
The Andex Chart is a powerful one-pager that shows the performance of different asset classes such as stocks, bonds, balanced portfolio, etc. over a period of time. The chart also shows the bull and bear markets since the 1930s.
The chart shows the growth of C$1,000 from 1934 thru 2022 for Canadian stocks, US stocks, Bonds, International stocks, etc. Over such a long-term Canadian stock earned an average annual return of 9.5%. However US equities performed even better with an average return 11.4% per year.
You can view/download the 2023 Andex Chart for Canadian Equity Market in here:
Source: Equitable Life of Canada
You may also like:
Related Andex Charts for other markets: