The S&P 500 is up by 19.59% year-to-date based on price only. However based on total return which includes dividend reinvestment the return is 21.36% so far this year. In the past few years the dividend yield on the index is around 2%. Though the yield is small, the difference between the price return and total return over the long term – such as a 5-year period will be high due to the magic of compounding.
The following chart shows the S&P 500 Price vs. Total Return over the past 5 years:
Click to enlarge
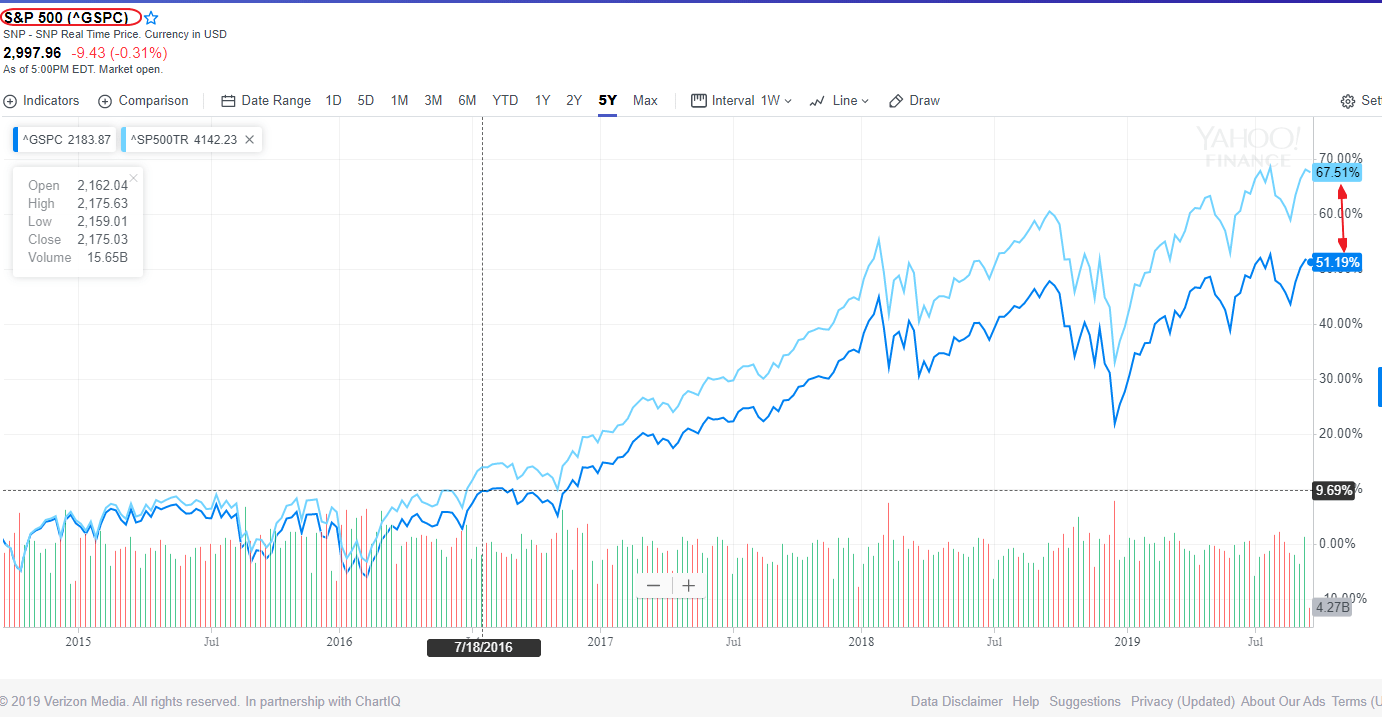
Source: Yahoo Finance
Over the past 5 years, the total return earned an investor 16% more than the price return. This shows the even a low yield of 2% can lead to much higher returns over many years.
Related ETF:
- SPDR S&P 500 ETF (SPY)
Currently no ETF tracks the S&P 500 Total Return Index.
Disclosure: No Positions


