The Periodic Table of Commodity Returns is published every year by U.S. Global Investors. While The Callan Periodic Table of Investment Returns shows the returns for various asset classes this table is specific to review the returns of commodities. The latest edition of commodities returns table including the returns for 2018 is shown in the chart below:
Click to enlarge
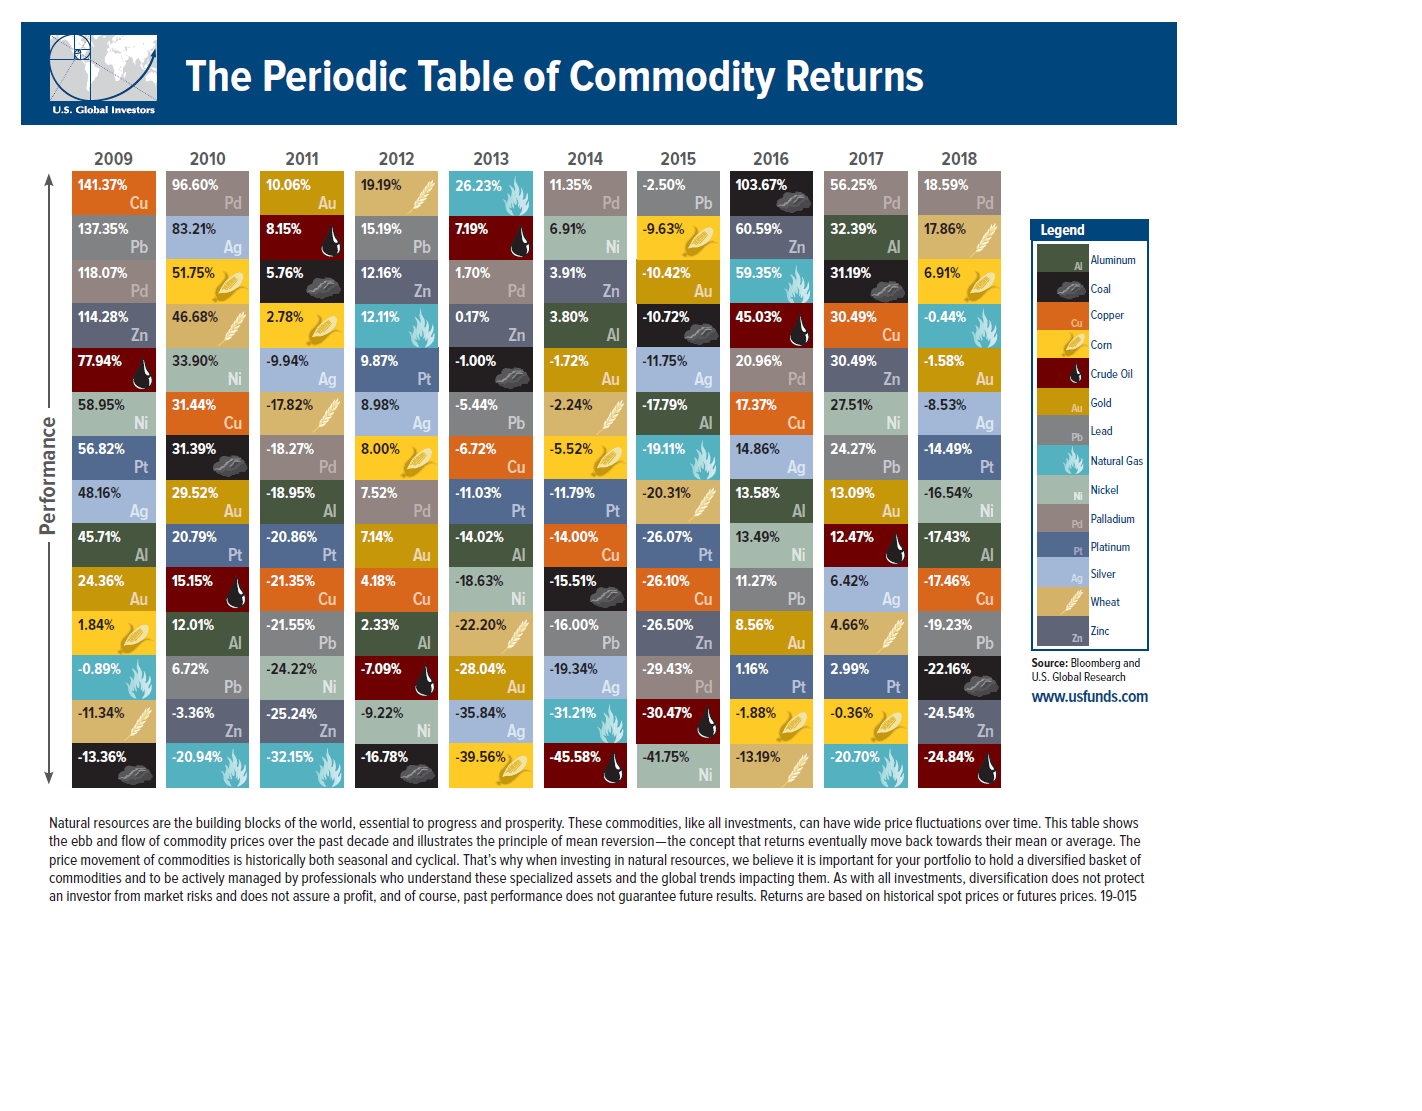
Source: U.S. Global Investors
The surprising winner among the major commodities last year was Palladium with a return of over 18%. Gold ended the year with a loss of about 2%.
The worst performer was crude oil as it plunged dramatically late in the year. Oil is an extremely volatile commodity as I have written in this blog before. So no one should be shocked by extreme volatility of this very important global commodity. In 2014, oil declined by over 45%.


