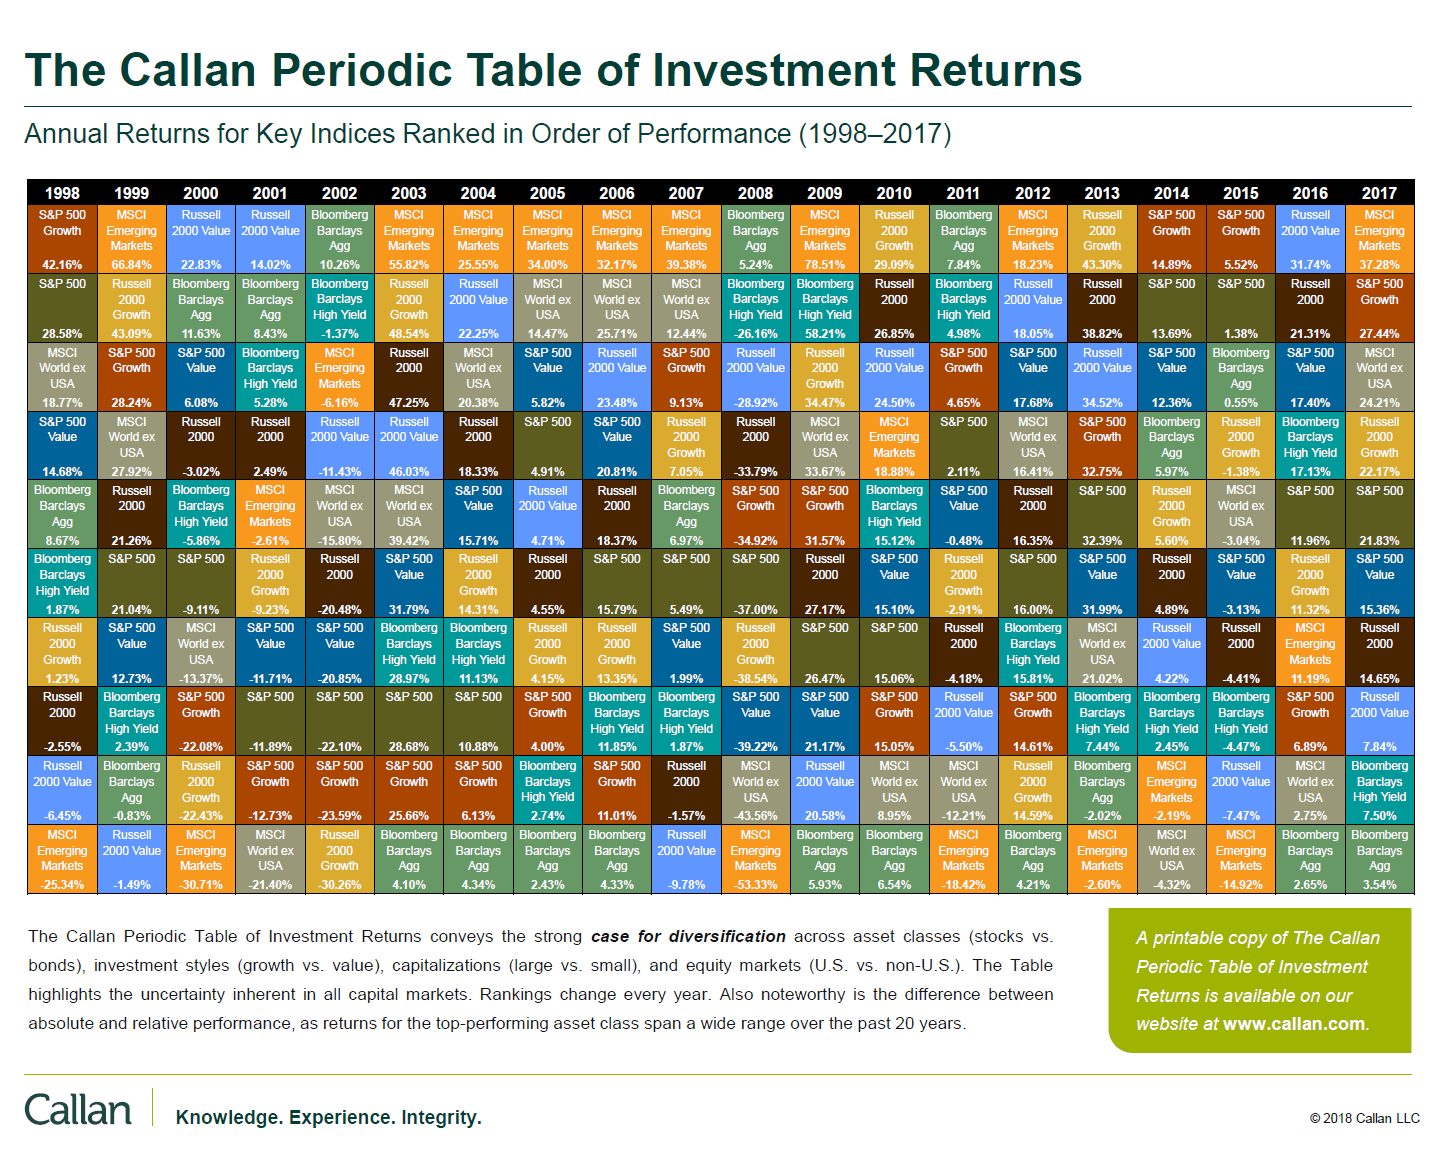
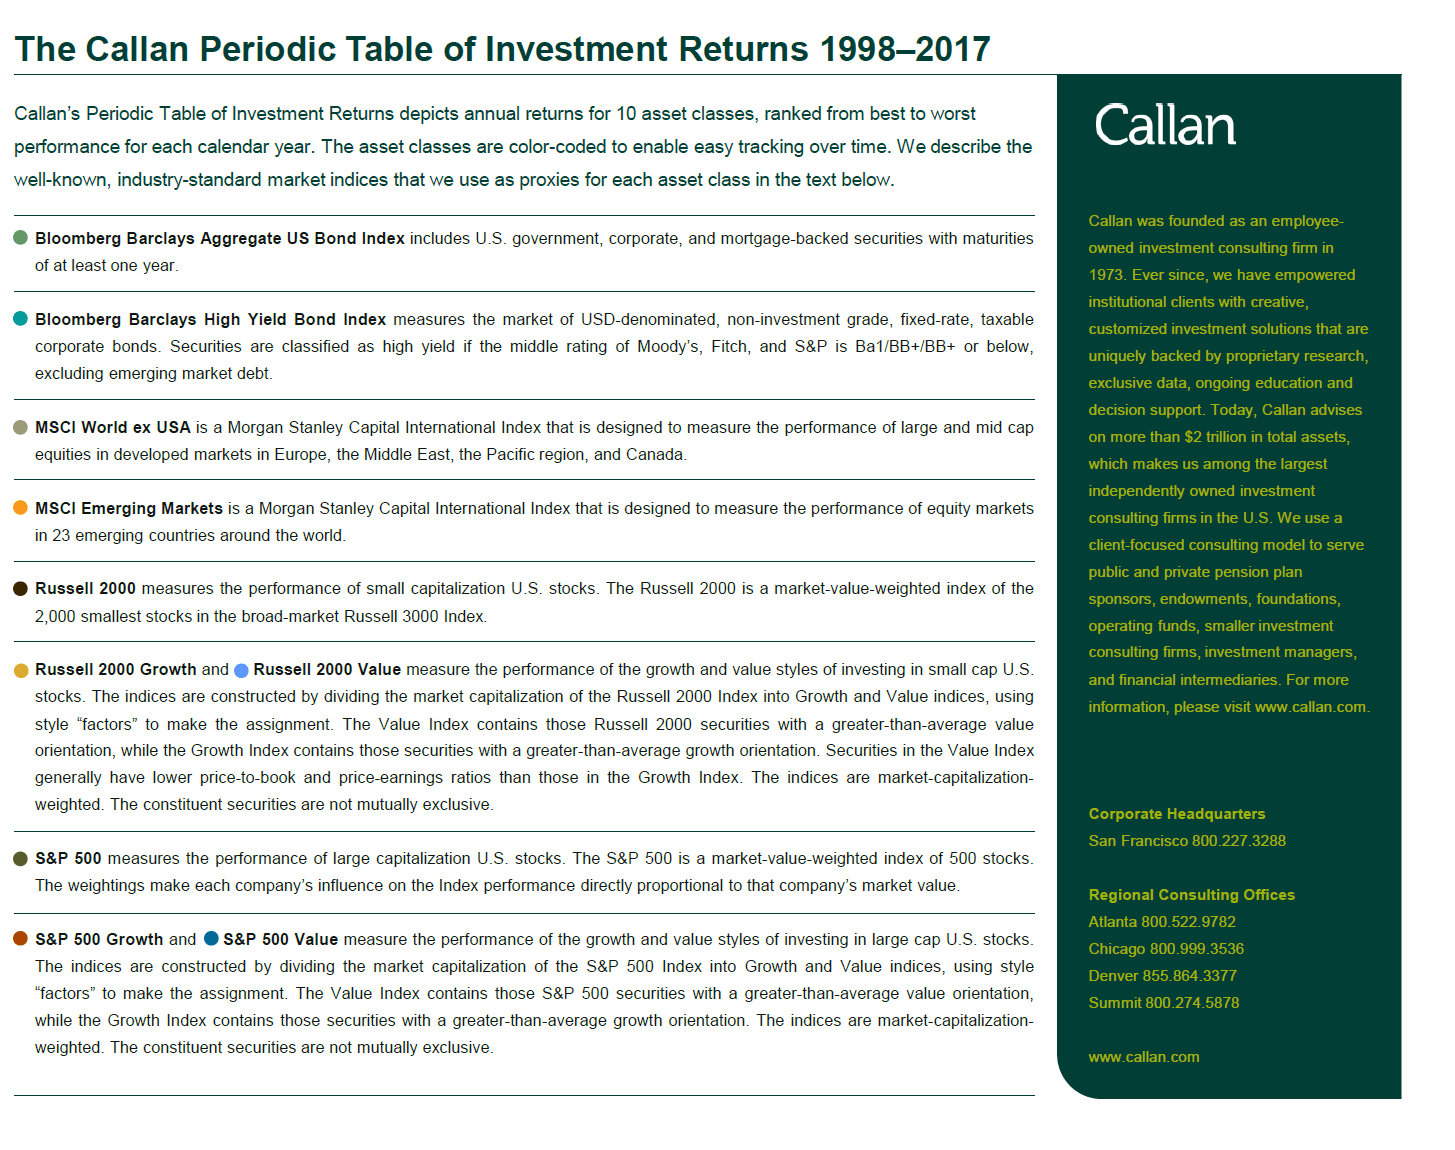
Callan Associates has released their famous “The Periodic Table of Investment Returns” for 2017. This chart shows the performance of stocks, bonds, US and foreign stocks, etc. by year.
The Callan Periodic Table of Investment Returns 1998-2017 is shown below:
Click to enlarge
Source: Callan Associates
Download: The Callan Periodic Table of Investment Returns 1998-2017 (in pdf)
A few observations:
Emerging markets were the best performing market last year with tThe MSCI Emerging Markets Index up over 37%. The S&P 500 returned around 22% but US growth stocks performed even better.
Earlier:
Related ETFs:
- iShares Dow Jones Select Dividend ETF (DVY)
- SPDR S&P Dividend ETF (SDY)
- Vanguard Dividend Appreciation ETF (VIG)
- SPDR S&P 400 Mid Cap Growth ETF (MDYG)
- iShares Russell Midcap Index Fund (IWR)
- iShares MSCI Emerging Markets Indx (EEM)
- SPDR S&P 500 ETF (SPY)
- SPDR STOXX Europe 50 ETF (FEU)
Disclosure: No Positions
