The U.S. equity market has performed well so this year with only one more month left to go. As of November end, the S&P 500 is up by 11.9% based on price returns and the Dow is up by 7.6%.
Among the emerging markets, India is the top performer year-to-date as the benchmark BSE Sensex has shot up by over 35% in local currency terms. The Sensex closed at 28,693 an all-time high. Also on Friday the total market capitalization of all companies on the Bombay Stock Exchange(BSE) crossed over US $1.6 Trillion making it the 10th largest exchange in the world. With over 5,500 companies listed, the BSE is the largest exchange in the world based on the number of listed companies.
Following the star performance of the Sensex is the Shanghai Composite index which is up by over 26%.Brazil has been a laggard this year also. The Bovespa has increased by a mere 6.10% as investors have been disappointed with the re-election of President Dilma Rousseff. Mexico’s IPC All-Share index and Chile’s IPSA are also average performers with returns of 3.4% and 5.2% respectively.
While China and India handily beat the U.S. market this year it is also important to see how they performed in the past. The following chart shows the Periodic Table of Investment Returns for Emerging Markets from 2004 to 2013:
Click to enlarge
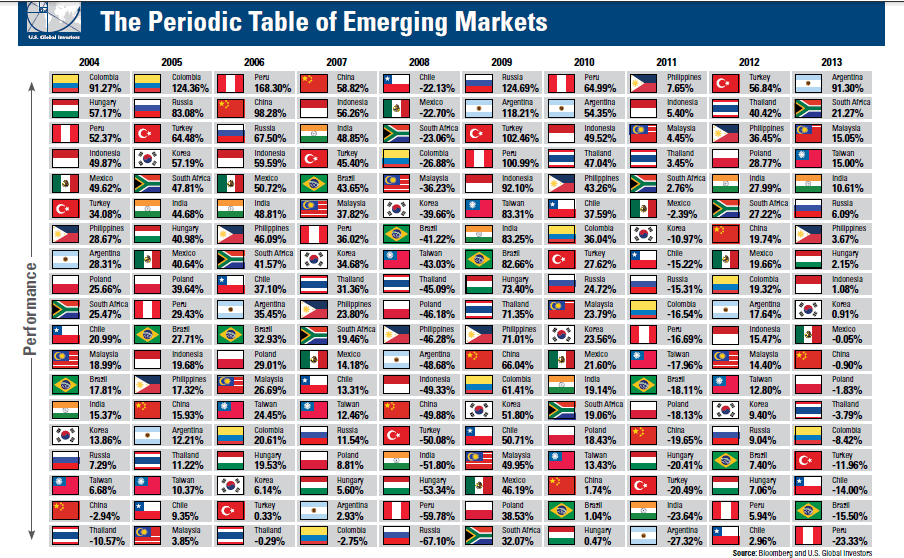
Source: Periodic Table of Emerging Markets 2013, U.S. Funds
A few observations from the above chart:
- India plunged by over 51% in 2008 during the global financial crisis but boomed 83% the following year. Brazil had a similar return in the same two years.
- With the exception of 2010, Indian stocks have yielded double digit returns every year since 2008.
- Since 2010, Brazilian stocks were relatively average performers with a double digit negative return in 2013.
- Though Argentina is shown as an emerging above, it is actually a frontier market. Though Argentina yielded solid returns since 2009 every year with the exception of 2011, the market is not for suitable for the faint of heart as the volatility in individual stocks can be stomach churning.
- The Malaysian stock market deserves much attention from international investors.In 2008, Malaysia was down by only 36% and has since generated a positive annual return every year.
Some related ETFs:
- iShares MSCI Mexico Investable Market Index (EWW)
- iShares S&P India Nifty 50 (INDY)
- iShares MSCI South Africa Index (EZA)
- iShares MSCI Brazil Index (EWZ)
- iShares FTSE/Xinhua China 25 Index Fund (FXI)
- Market Vectors Russia ETF (RSX)
Disclosure: No Positions


