The S&P 500 is one of the widely followed U.S. benchmark equity indices. This index is a better barometer of the U.S. markets than the Dow Jones Industrial Average or the NASDAQ indices. Here are some interesting facts about S&P 500:
- The index was first published in 1957.
- The 500 companies in the index are the leading companies in the leading sectors of the U.S. economy capturing 75% coverage of U.S. stocks
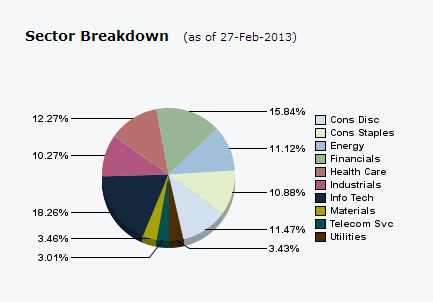
- The sector breakdown is shown in the chart below:
Click to enlarge
- The average dividend yield of the index is about 2%.
- As of Feb 27, 2013 the price return for 1, 3 and 5 years are 14.15%, 11.74% and 1.68%. But the total returns for the same periods are 16.78%, 14.14% and 3.97% respectively due to the addition of dividend returns.
Source: Standard & Poor’s
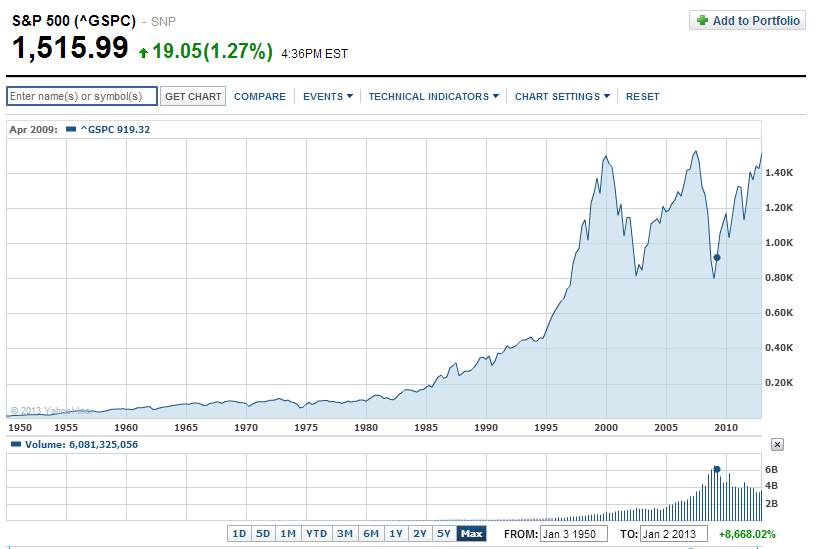
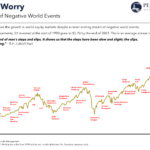
a) S&P 500 – Long Term Price Returns:
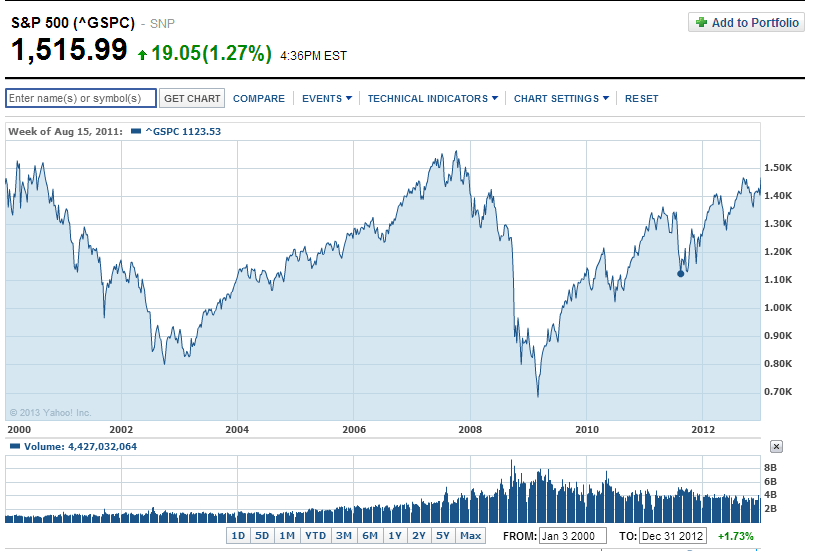
b) S&P 500 – Price Returns since 2000:
Related ETF:
SPDR S&P 500 ETF (SPY)
Disclosure: No Positions
