Diversification across sectors is important for well-diversified portfolio. No sector is the best performer each year. So this year’s best performing sector may turn out to the worst one next year. For example, the tech sector is the hottest one this year with soaring stock prices especially for the FANG stocks. Next year they may not be able to replicate this growth. In the graphic below, the last time the tech sector topped all the other sectors was in 2009.
The following chart shows the various sector returns for US stocks from 2007 thru 2016 full year. Since the return shown for 2017 is for Q1 only we can ignore that last column.
Click to enlarge
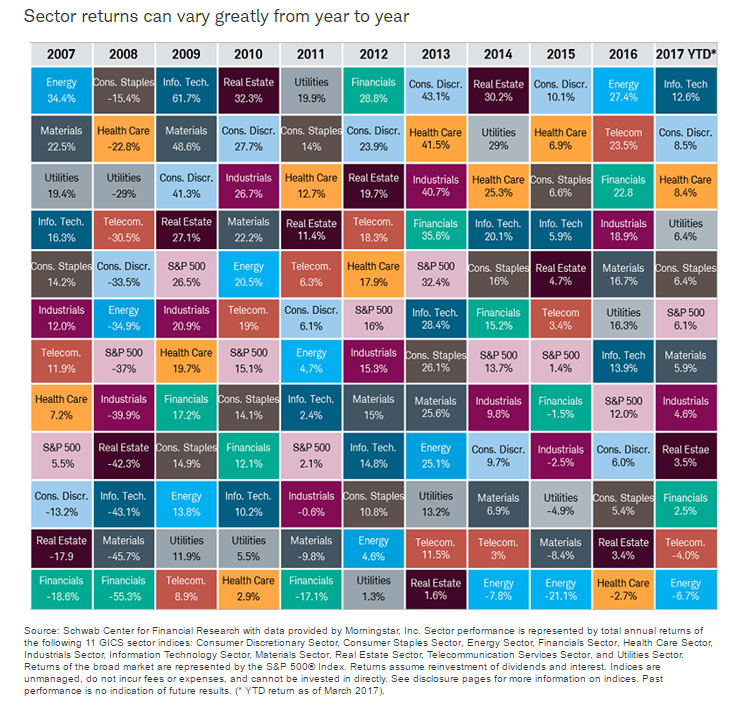
Source: Schwab Sector Views: From the Top Down, by Brad Sorensen, Schwab
Back in 2007, energy stocks were the rage with a nearly 35% total return. But in recent years oil prices have collapsed and accordingly in 2014 and 2016 the energy sector was the worst performing sector.But last year the rebound in oil and gas prices propelled energy stocks to the top of the chart with a 27% total return.
The key takeaway for investors is that in additional to diversification across regional, country, value, growth and mid/small.large caps, etc. sectoral diversification is also required for long-term success in equity investing.