Can Infrastructure Spending Revive US Economic Growth?

Infrastructure is one of the key sectors that will see large investment as part of the massive $787 billion package signed President Obama last month. The law titled “American Recovery and Reinvestment Act” will promote investment in infrastructure such as roads, bridges, electricity grid, etc. Billions of dollars will pour into these projects over the next months.

But is this infrastructure spending necessary now? Will it help revive the long-term economic growth?.

According to the Organization for Economic Cooperation and Development (OECD) spending on infrastructure projects will be beneficial for long-term prosperity. Yesterday March 3rd, the OECD released the Going For Growth 2009 report. This flagship “annual periodical provides an overview of structural policy developments in OECD countries from a comparative perspective.” In this report, Klaus Schmidt-Hebbel, the Chief Economist says that infrastructure performs a vital role in the functioning of our economy. However in the past, some investments made in this sector have been wasteful.

The report identifies many policies that can “both boost demand in the short term to soften the impact of the recession, and also raise economic growth over the long term. This ‘double dividend’ can be achieved by pursuing policies areas such as:

  • Increased spending on infrastructure
  • Increased spending on active labor market policy
  • Reduction of personal income taxes

Charts – Investment in Infrastructure Sectors (click to enlarge)

A)Infrastructure Investment as a % of Total Investment

OECD Infastrucure - Water

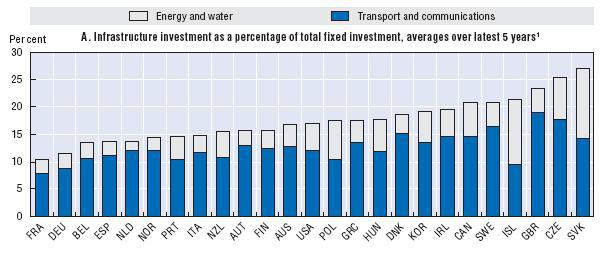
The above diagram shows that the USA has lagged in infrastructure spending on energy and water, transport and communications in the last 5 years when compared to other OECD countries such as Sweden, Denmark, Korea, Great Britain, etc.

B) Electricity, Gas and Water Investment as a % of GDP

OECD Infrastructure - Electricity

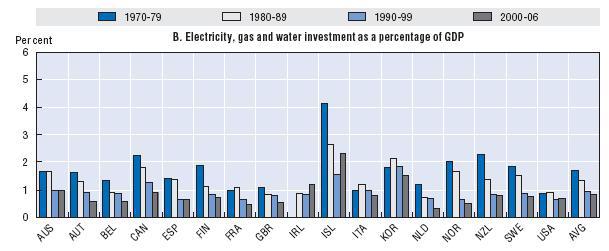
In the years 2000-2006, we spent below the average in electricity, gas and water investment as a % of GDP. Less than 1% of the GDP went into these areas. Sweden, Norway, Israel, Korea, Ireland spent more than USA in these sectors during the time period. The US invested a higher portion of the GDP during the 70s and 80s but has slipped in the past few years.

C) Transport and Communications Investment as a % of GDP

OECD Infrastructure - Transport

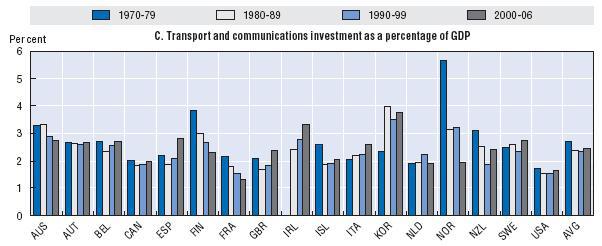
Source: OECD -Going For Growth 2009

Investments in transport and communications were less than the average of all OECD countries during 2000-06. Only France spent less than us in the same period. Many countries such as Austria, Australia, Sweden, Korea, Spain spent a larger portion of their GDP on these two sectors.

In summary, from the above three charts it is clearly evident that infrastructure spending needs to be increased in the US. The OECD report mentions that investment investments may have positive spillovers throughout the other parts of the economy. But to reap the full benefits of such investments, it is essential to carefully select projects that will deliver the most benefits. Furthermore strong regulatory measures must be in place to ensure competition among market players in executing the projects. While I agree with Klaus Schmidt-Hebbel on the “double dividend” theory it is not 100% sure that infrastructure spending will revive growth in the US. This is due to the fact that the US economy was mostly supported by the consumer spending. It is unlikely that the consumer will start spending again with just because of all the new roads, bridges, schools, green buildings, etc.However in the long-term having high-quality infrastructure will promote sustainable growth and improve the standard of living.

The World’s 50 Safest Banks 2009

The Global Finance magazine released the world’s safest banks list for 2009 on February 25th. For the first time they published this mid-year update due to the turmoil in the world’s banking industry.

The list was compiled based on the comparison of long-term credit ratings and total assets of the 500 largest banks in the world. The ratings were issued by Standard & Poors, Moody’s and Fitch.

According to Global Finance publisher Joseph D. Giarraputo “The rating agencies have determined these banks have demonstrated a more prudent and sustainable approach to risk than their peers.”

The World’s 50 Safest Banks 2009

[TABLE=140]

Source: Global Finance magazine
If a bank trades in the US markets the ticker is listed.

Some Observations:

All the five large Canadian banks are in this list. This is interesting since recently there have been many reports praising the banking system in Canada which is holding up pretty well when compared to banking systems in other countries. US-based banks Citibank(C) and Bank of America (BAC) did not make it to the list. Three of the large banks in Singapore were selected. It is not clear why most of the countries outside of the developed world is not included in the rankings.

For The World’s Top Ten Safest Banks in 2008, go here.

For The Top 20 Global Banks in 2009 by Brand Value go here.

S&P 500 Index Return Analysis

The S&P 500 Index is the best barometer of the US stock markets and is widely followed by investors worldwide. It contains the 500 leading companies in leading industries of the economy. The year to date (as of February end) performance of this index and the individual sectors within the index are shown below:

[TABLE=138]

The S&P 500 is down year-to-date 18.62%. But on a total return basis it is down 18.18%. Total Return(TR) is the price plus gross cash dividend return. Financials is the worst performing sector with a loss of 40.07% followed by Industrials at 28.34%. Last year the financials were off an incredible 56.95%. While health care and consumer staples are expected to perform better during recessions they are not the top performers. The best performing sector YTD is Information Technology. This is very surprising since during economic downturns companies cut back on new IT investments. Besides IT is never really considered a stable sector. Overall usual suspects utilities, healthcare, telecom and consumer staples have held up relatively well with losses of about 14%.

The yearly return of the S&P 500 is shown below:

[TABLE=139]

Last year the index dropped 37% (TR). Out of that dividends contributed -4.01%. The dividend component was 1.49% of the return of -38.49%. Hence last year dividend yield on the S&P 500 was less than 2%. Compared to 2007, the 2008 dividend yield is less since some companies reduced or suspended dividends last year.

During the years 1995 thru 1999, the index yielded double digit returns each year.As seen from the table above, S&P index fell much lesser than 38% even when the dot com bubble burst. With the S&P 500 currently at 735, some bears are projecting a fall to 500 levels if the recession deepens.

New Car Registrations in Europe Fall 27% in January

The auto industry is one of the largest sectors of the economy in USA and Europe after housing. The industry is also important because of the multiplier effect on the economy. For example, one auto industry job indirectly creates many more jobs. According to one study, each auto job creates five jobs among suppliers.Others peg that number even higher. The Governor of Michigan Jennifer M. Granholm wrote in CNN.com last November that “The auto industry supports one of every 10 jobs in the United States”. The correct number is probably somewhere between 5 and 10. In addition to supporting many related jobs, the auto industry also creates economic activity such as retail sales, financing for cars, tax generation, etc. Since majority of car purchases are financed with credit, it has a direct relation to banks and other lenders. In a nutshell, it is important to keep track of the auto industry since it can be considered as the barometer of the economy in many countries of the world.

Despite having a good public transportation system, Europeans love cars. One way to analyze how the automakers may be affected in Europe is to review the registrations for new cars. Based on the data released by the European Automobile Manufacturers’ Association(ACEA), registrations of new passenger cars in Europe fell by 27% in January compared to January last year.

Figure #1: New Car Registrations in January (click to enlarge)
New Car Registrations in Europe
Source: ACEA

The data represents Western Europe and the new EU member states excluding Malta and Cyprus. In January 2009, just 958,500 cars were registered which is the lowest level in two decades as shown in the diagram below.This shows the severity of the credit economic crisis.

Figure #2: New Car Registrations in January since 1990 (click to enlarge)
New Car Registrations in Europe since 1990
Source: ACEA

The registrations for individual countries present a different perspective.

Western Europe:
Iceland = -88.1%
Ireland = -66.5%
Spain = -41.6%
Italy = -32.6%
UK = -30.9%
Germany = -14.2%
France = -7.29%

It is not surprising to see Iceland top the list since the whole country went bankrupt. The Irish economy is suffering worse than other Western European economies. Interesting to see that France is the least affected.

New EU Member States:
Overall the demand for cars dropped by 34%.

Romania = -53.2%
Hungary = -52.3%
Czech Republic= – 12.3%
Poland = -5.3%

Some of these former communist countries such as Hungary are facing serious economic challenges and are expected to receive emergency aid from The World Bank and the EU.Poland is holding up well than other countries.

The following are two interesting observations found in the ACEA’s Q&A page:

1.Why is the crisis hitting the auto industry so hard?
The fall-out of the financial crisis hits auto manufacturers hard, as the credit crunch makes it more difficult for the sector to finance daily operations and, at the same time, also weakens demand for new cars. Consumers are increasingly hesitant to make large expenditures and find it more difficult to get their purchase financed.

European new passenger car registrations fell by 7.8% to 14,712,158 units in 2008, recording the sharpest decline since 1993. In the fourth quarter of 2008, registrations were down 19.3%.

The manufacturers have a model range that is well up to date and fuel-efficient. The drop in demand is clearly an effect of the financial and economic crises. In the firs half of this year, sales remained well on track. Our industry needs a functioning financial market, and governments can help by giving market incentives to restore consumer demand.

2. Are the situation of the US and EU automotive industries comparable?
The EU industry is in a different position in terms of restructuring, product lines and market demand, regulatory environment. EU vehicle sales only began to crash in July of 2008, where they have been in significant decline in the US for more than a year and are now travelling at 30-40% below recent levels. Unfortunately, EU sales forecasts are showing a similar downward trend line, so while we might hope that the recession will be shallower in the EU, it is premature to say that this will be the case.

In terms of vehicle markets, it is important to note that the US hardly have a diesel market for passenger cars. This is one of the reasons why the vehicle mix in both regions is so different. Another reason is the difference in petrol price. On average, because of taxation, petrol prices in the EU are two and a half times that of the US (approx US$5/US gallon compared to the current US average of about $1.80/gallon) This drives quite a different mix of vehicles sold. ”

As the exports of new cars continue to fall from European countries such as Germany and the domestic demand dries up in the EU, it will be interesting to monitor the developments in the coming months.

US Home Foreclosures: Caught In a Never-Ending Vicious Cycle?

The housing sector is the root cause of the current credit crunch. For more than a year the economy has been suffering from a severe recession and home foreclosures are rising day after day. As the economy worsens further and unemployment level increases foreclosures are bound to skyrocket as well. In this scenario, preventing closures has become one of the key goals of the Obama administration. However reduction of foreclosures is not easy for many reasons. The main reason being that people who cannot afford to pay mortgages should not bought the homes in the first place. Efforts to keep those folks in their homes will not succeed unless their “underwater” values of their homes are erased and their loans redone with heavy cram-downs (reduction of principal owed) and interest-rate changes. Even then it is possible that loan modifications will not help when folks can’t pay their mortgages due to losing jobs, unexpected expenses, etc.

So in order to understand how the foreclosure crisis is impacting the overall economy, I reviewed a recent position paper from IMF titled “Foreclosure Mitigation Efforts in the United States: Approaches and Challenges”. In this paper the authors argue that the burden of restructuring mortgages must be borne by the taxpayers since foreclosures play a key role in adverse housing market dynamics. With foreclosures rate reaching the highest levels since the Great Depression, the paper adds “With house prices falling, lending standards tightening, unemployment rising, and interest rate resets in the pipeline, foreclosures are projected to go even higher”.

The following diagrams nicely illustrate the vicious cycle of falling home prices and its relationship to the overall economy:

Housing Feedback Loop (click to enlarge)

US Housing Loop

Housing Loop and Macro-Financial Linkages(click to enlarge)

US Housing Loop and Financial Linkage

Foreclosure starts and inventory started rising at an alarming rate after after 2007 as the diagram shows below.

Foreclosure Starts and Inventory (click to enlarge)

US Foreclosures Rate

Source: IMF

More details can be found in the paper located here.