Top 25 NASDAQ Stocks Ranked by Market Cap

Last week Jason Zweig discussed about the popping of the tech bubble ten years ago in the article When Bubble Burst: Companies Won, Investors Lost.

From the article:

“The Internet did change business forever, just as investors had predicted. And a handful of technology companies did strike it rich. But by far the biggest beneficiaries of the Internet boom were the companies that adopted the new technology rather than those that provided it. When I asked Aronson+Johnson+Ortiz LP, a Philadelphia money manager, for a list of the 100 top-performing stocks over the past decade, the roster was dominated by energy, health-care, materials, industrial and even financial companies. Only eight tech stocks made the list.

That’s mainly because their share prices got so inflated in the first place. As businesses, tech companies did very well. Technology was the most profitable sector in the Standard & Poor’s 500-stock index in 2009, contributing $93 billion of earnings, estimates Strategas Research Partners. Since the beginning of 2000, tech companies have generated $608 billion in cumulative profits. They have piled up $349 billion in cash, or 35% of the total at nonfinancial corporations. And over the past 10 years, Amazon has doubled even as the S&P 500 went nowhere.”

Some of the tech giants from the 90s such as Apple, Microsoft ,Intel, Cisco, etc. continue to be among the largest companies on the NASDAQ market.

The Top 25 Companies ranked by Market Capitalization are listed below:

[TABLE=413]
Foreign Markets Offer Higher Dividend Yields

The current yield on the S&P 500 is just over 2%. Last year the yield was 2%. Many foreign markets offer higher dividend yields than the U.S. This is especially true with most developed countries.

In 1979, the S&P 500 had a 5.53% yield. But since 1990, it has steadily decreased  and reached a low of 1.89% in 2007. In 2008, the yield rose to 3.11%. The current yield of just over 2% is very low. This is because many U.S. companies believe in reinvestment or retained capital as opposed to paying out a higher portion of profits to investors as dividends. In November last year, the Journal reported that the 500 largest non-financial companies by assets in the U.S. had stashed about $994 billion in cash and short-term investments.

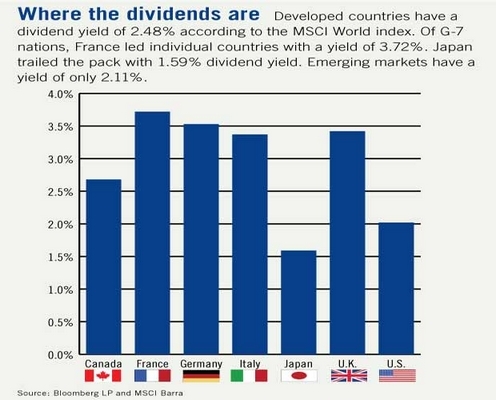
The chart below shows the current dividend among G-7 countries:

Current-Dividend-yield-G7-Countries

Source: Pensions & Investments

Except Japan, all other countries have higher yields than the US. European companies traditionally have had higher payout ratios and continue to follow that policy.

The following 13 Foreign Stocks have Dividend Yields of Over 5%:

[TABLE=412]

The List of Global Tier 1 Gold Mining Companies

In this post, let me list some of the Tier 1 gold miners and a few copper miners. But before we get into the list, here are some interesting facts about gold:

  • US Gold Reserves totaled 8,133.5 tons in September 2008, accounting for 76.5% of its forex reserves
  • Japan holds 765.2 tons of gold which accounts to 1.9% of its forex reserves
  • China’s gold reserves amounted to 1,054 tons in 2009 which was a 76% increase in six years and accounts for 1.9% of its forex reserves
  • China surpassed South Africa as the world’s largest gold producer in 2007
  • China beat India as the world’s largest gold consumer in 2009

From the World Gold Council:

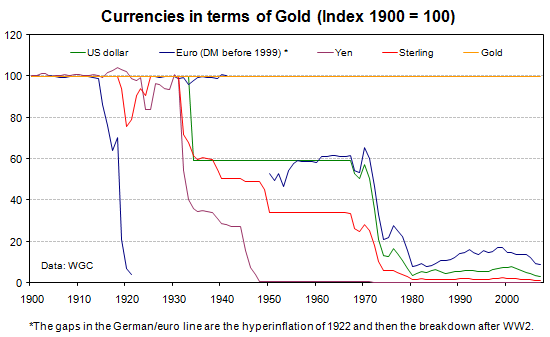
“The value of gold, in terms of the real goods and services that it can buy, has remained largely stable for many years. In 1900, the gold price was $20.67/oz, which equates to about $503/oz in today’s prices. In the five years to end-December 2008, the price of gold averaged around $606. So the real price of gold has endured a century characterised by sweeping change and repeated geopolitical shocks and more than retained its purchasing power. In contrast, the real value of most currencies has generally declined.”

Gold-Inflation

Some of the Global Tier1 Gold Miners are:

1. Company: Yamana Gold Inc (AUY)
Country: Canada

2. Company: GoldCorp Inc (GG)
Country: Canada

3. Company: Polyus Gold (OTC: OPYGY)
Country: Russia

4. Company: Harmony Gold Mining Company Ltd (OTC: HGMCF)
Country: South Africa

5. Company: Lihir GOld (LIHR)
Country:Papua New Guinea

6. Company:AngloGold Ashanti(AU)
Country: South Africa

7. Company: Zijin Mining Group Ltd
Country: China

8. Company: Barrick Gold Inc (ABX)
Country: Canada

9. Company: Newcrest (OTC:  NCMGY)
Country: Australia

10. Company: Gold Fields
Country: South Africa

11. Company: Kinross Gold Corp (KGC)
Country: Canada

12. Company: Newmont Mining Inc (NEM)
Country: USA

13. Company: Compania de Minas Buenaventura SA (BVN)
Country: Peru

14. Company: Freeport McMoRan Copper and Gold Inc (FCX)
Country: USA

For investors that prefer to invest in gold via an ETF, the SPDR Gold Shares Trust (GLD) offers one option. This ETF tracks the price of gold. The Trust’s allocated gold bullion is kept in the form of London Good Delivery bars with custodian HSBC Bank USA in its London vault or in the vaults of sub-custodians. The fund has $39B in assets and the expense ratio is 0.40%. Zijin Mining Group Ltd is one of the largest gold producers in China.

Related:
The List of Diamond Mining Stocks by Country
The World’s Top Diamond-Producing Countries

Knowledge is Power: Big Gold,China, Debt Doom Edition

Special report: Are the days of “big gold” over? As cash pressures mount, gold majors move to mine the markets, which are proving more lucrative than the mining of gold.

Built on a Lie – The Fundamental Flaw of Europe’s Common Currency

A new forecast from RBC Economics says Canada’s economy is poised for real GDP growth of 3.1 per cent this year and 3.9 per cent in 2011. Canadian economy ready for major rebound, RBC says

Debt doom ahead US Congressional Budget Office figures, showing how horrendously large the national debt will become, indicate that the United States economy will be 71% bigger within 10 years. If everything costs twice as much by then, why not? And the only people better off will be those who are buying gold now!!!

China showing signs of overheating

CHINA’S industrial output has hit a five-year high, adding to the case for the Government to pare back stimulus measures.

Can the Chinese Renminbi Replace the US Dollar as the World’s Reserve Currency?

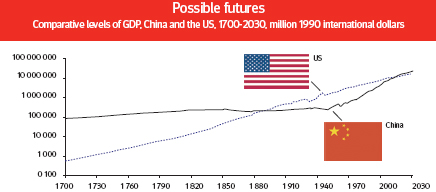
China was the world’s largest economy before 1890. According to Professor Angus Maddison, author of the Chinese Economic Performance in the Long Run, China’s role in the world has changed dramatically in the last thousand years and China is likely to become the world’s largest economy by 2015 beating the US. The author mentioned that China’s economic growth in the next 30 years will not be diminished due to the recent global credit crisis.

The graph below shows the possible futures for the economies of China and the US:


US-China-GDP-Comparison

Source:  Towards a new reserve currency system?, OECD Observer

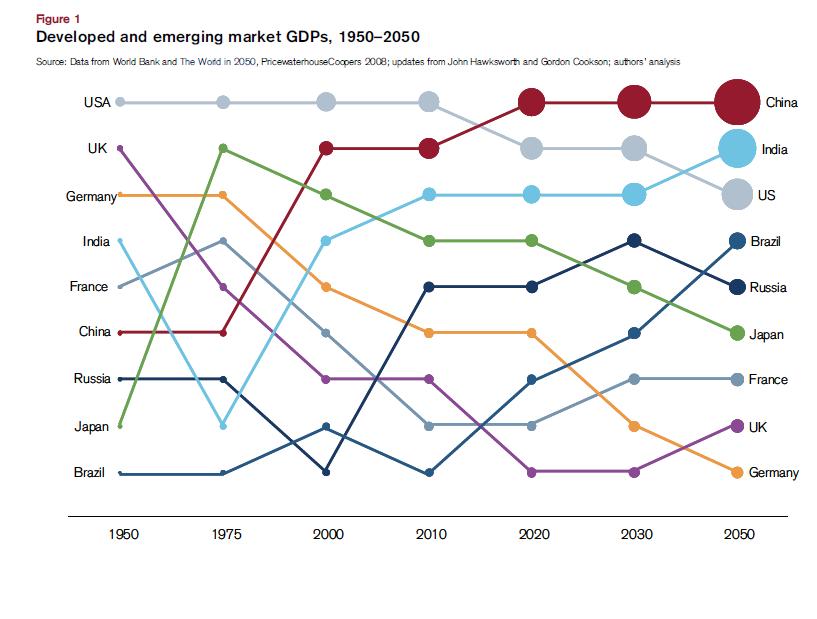
Chart showing the projected growth of GDP in Developed and Emerging Markets thru 1950:

Developing-Emerging-Markets-GDP-Comparison

After the World War II, the US dollar dethroned the British sterling to become the world’s reserve currency. The dollar accounts for about two-thirds of the global reserves and 88% of daily foreign exchange trades.

From the OECD Observer article noted above:

The additional demand for dollars has generated “seigniorage” revenues: in 2008 the US Fed made a net interest income of $43 billion from issuing the currency, which as The Economist newspaper once put it, effectively makes US dollars in global circulation an interest-free loan by the public to the nation’s central bank.”

Empires based on currency rise and fall according  to Professor Avinash Persaud. In his 2004 speech titled “When Currency Empires Fall”  he noted the following:

“There are good reasons why there is seldom more than one dominant currency. Reserve currencies have the attributes of a natural monopoly or in more modern parlance, a network. If it costs extra to trade with some one who uses a different currency than you, it makes sense for you to use the currency that most other people use, this makes that currency yet bigger and cheaper to use. There is a good analogy with a computer operating system. In that world, Windows is the dollar.

This networking power is why Central banks store dollars in their reserves in a far greater proportion than the proportion of trade with the US. While 30% of international trade is with the US, 70% of central bank reserves are in dollars. It is why most commodities, like oil, copper and coffee are priced in dollars, wherever they are found and whoever they are sold to.

Something else we can be more certain of is that reserve currencies come and go. They don’t last forever.  International currencies in the past have included the Chinese Liang and Greek drachma, coined in the fifth century B.C., the silver punch-marked coins of fourth century India, the Roman denari, the Byzantine solidus and Islamic dinar of the middle-ages, the Venetian ducato of the Renaissance, the seventeenth century Dutch guilder and of course, sterling and now the dollar.

A necessary condition of a currency becoming a reserve currency appears to be its breadth of use and cost and ease of transaction, not, as some might think, the ability to hold its value. Clearly hyperinflation would not serve a reserve currency, and the end of reserve currency status is often associated with a cycle of inflation. But within the normal bands of inflation, it is size as a trader that matters. In the long-term, the Swiss franc and yen have been better stores of value than the dollar. Since 1980, they have appreciated by more than 21% and 54% versus the dollar respectively. Yet for much of this time, combined, they have represented no more than 10% of central bank reserves.

In the 18th century Britain was the largest economy of the western world, London was the centre of international trade and finance, the currency was convertible and so sterling became the world’s reserve currency. By the late 19th century, the US had become the world’s largest economy, a position solidified by Europe’s repeated attempt at self-annihilation from the 1880s to the 1940s. By the 1960s, the dollar had usurped sterling and was the world’s new reserve currency with 60% of total central bank reserves being held in dollars, twice the level of sterling reserves.

But time doesn’t stop. By the mid-21st century, the US will no longer be the world’s largest economy. By then, China and India will have overtaken the US, western Europe and Japan, on purchasing power parity terms at least, which should represent where exchange rates are likely to be in the long-run. Indeed optimistic measures of sustainable growth in China and India suggest this will be the case in twenty years time. Ladies and gentlemen, within my life time, the dollar will start to lose its reserve currency status, not to the euro, but to the renminbi.

According to the latest Treasury data, the Chinese hold $ 894.8 billion of US Treasury securities as of December 2009. China is the largest creditor nation in the world while the US is the largest debtor nation. The Chinese renminbi may become the global reserve currency by 2050 since its economy in terms of purchasing power parity is projected to outstrip the US economy. However China has to make its currency fully convertible, remove restrictions on foreign capital entering and leaving the country, accelerate financial reforms before the renminbi can become the world’s currency of choice.

Related:

The Rise of the Renminbi: Will China’s Yuan Become a Global Reserve Currency?, July 23, 2015, Mark Mobius