Automobile Production: China vs. USA

China became the largest car market in the world in China surpassing the U.S. Just over 40% of all car produced in China are made by domestic automakers such as Geely, Chery, Hafei, BYD, etc.

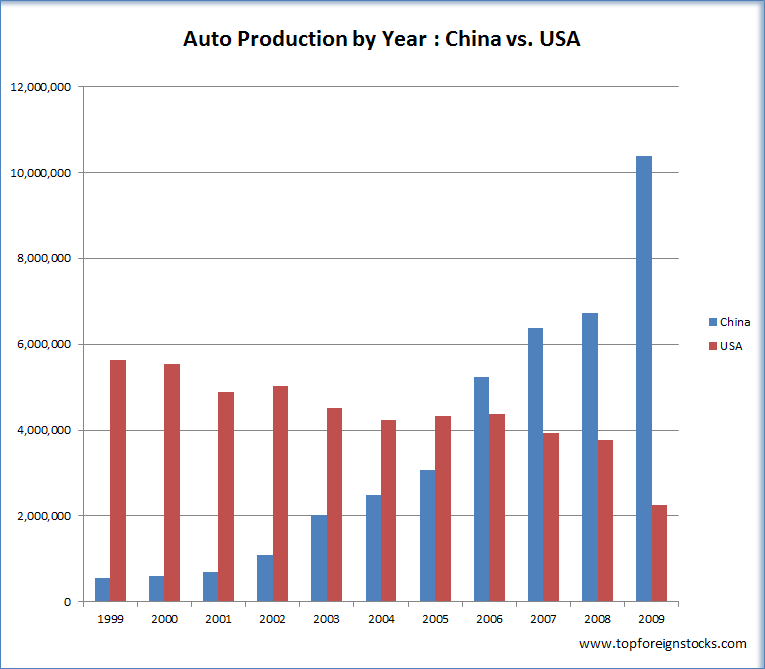
Car production in China started to increase drastically since the late 1990s due to various government incentives that encouraged auto sales. The chart below compares the annual auto production in China and the U.S.:

Click to enlarge

Cars-Production-US-vs-China

Source: International Organization of Motor Vehicle Manufacturers

The blue bar in the chart shows the soaring Chinese auto production numbers.Clearly the U.S. market has saturated in recent years and production volume has declined from about 5.6 million units in 1999 to 2.2 million in 2009. Since the auto industry generates hundreds of thousands of jobs both directly and indirectly the lower production numbers in the U.S. mean lesser number of jobs created. The majority of the cars produced in China is sold locally. While the growth of auto sales creates issues such as pollution, congestion, etc in major urban areas there is still a huge untapped market in rural areas. Hence Chinese auto production may continue to increase in the coming years. Rising income levels among the middle class and more state subsidies for auto makers will benefit the industry as well.

Disclosure: No Positions

China’s Top 10 Auto Makers

China is the largest auto market in the world. Through November this year auto sales is up 34% compares to 2009. The list of China’s top 10 automakers by sales as of November 2009 and their relative market share is shown below:

RANKING AUTOMAKERS     JAN-NOV SALES  MKT SHR (PCT) VS  2009

 1. SAIC Motor (600104.SS) 3.27 mln        19.9     vs  19.8 (1)

 2. Dongfeng Motor         2.47 mln        15.1     vs  13.9 (3)

 3. FAW Group              2.33 mln        14.2     vs  14.3 (2)

 4. Changan Auto           2.16 mln        13.2     vs  13.7 (4)

 5. Beijing Auto           1.36 mln         8.3     vs   9.1 (5)

 6. Guangzhou Auto         0.66 mln         4.0     vs   4.5 (6)

 7. Chery Automobile       0.61 mln         3.7     vs   3.7 (7)

 8. Brilliance Auto        0.47 mln         2.9     vs   2.6 (9)

 9. BYD (1211.HK)          0.47 mln         2.9     vs   3.3 (8)

10. Jianghui Auto          0.43 mln         2.6     vs    --

Source: Reuters

None of the automakers noted above trade on the organized U.S. exchanges. BYD Co trades on the OTC market with the ticker BYDDY.

The top auto makers in China and India can be found here.

china2.jpg

Disclosure: No positions

25 U.S. Stocks With High Emerging Market Exposure

One way to profit from growth in emerging markets is to invest in US companies that derive a significant portion of their business from these markets. Using this strategy one avoids the problems with the time consuming task of identifying, researching and selecting high-quality foreign companies. While investing in foreign stocks directly is a better option, it is always not possible to invest in them. This is because many companies in emerging markets are not public as they are controlled by business families who do not want to share the profits with others. In addition accessing information and finding ways to easily invest in the publicly-traded emerging market firms can get difficult. Hence for some investors the simplest way to access emerging markets(EM) may actually be investing in domestic companies with large EM exposure.

Identifying U.S. companies that generate a large part of their earnings from emerging markets is not easy. Despite the high level of transparency in reporting financial information by US firms, more than half of the S&P 500 companies do not report their earnings by country. The following is a list of companies with high EM exposure:

[TABLE=857]

Note: This list was compiled from many sources.

Investors can use the above list of stocks as a starting point for further research.

The first 21 stocks are S&P 500 Index constituents. Praxair (PX) and Mettler-Toledo International (MTD) earn about 35% of their revenues from emerging markets. Alexion Pharmaceuticals (ALXN) earns 50% of its revenues from outside the U.S. and about 43% of wireless services operator NII Holdings'(NIHD) revenues come from Brazil.

Related Posts:

25 European Companies with High Emerging Market Exposure

Nine U.S. Consumer Staples Companies With High Emerging Market Sales

21 European Consumer Staples Companies With Strong Emerging Markets Exposure

22 Stocks to Profit from Emerging Market Consumer Sector Growth

Disclosure: No Positions

U.S. Investors Putting More Money Into Foreign Stocks

I have written many times before that most U.S. investors are underweight in their exposure to foreign markets. Despite the stagnant economy at home and tremendous growth in foreign markets, Americans still cling to the idea that U.S. stocks are somehow safer and better than international stocks. They can easily earn higher returns going overseas. For example, the S&P 500 is up 11.6% YTD. But Canada, Mexico, Germany, Sweden and Israel are up by 13.8%, 18.7%, 18.5%, 23.3% and 14.0% respectively.

It appears that more Americans are starting to discover investment opportunities outside of the U.S. An article in The New York Times notes that for the fourth consecutive year Americans withdrew money from mutual funds that primarily invest in domestic stocks. But they have put more money into funds that invest in foreign stocks and also hybrid funds for two years in a row.

net-cash-flow-mutual-funds-us.gif

From the article:

THE love affair of American investors with the stock market appears to have ended.

The year now ending will be the fourth consecutive year in which mutual funds that invest primarily in American stocks experienced net outflows of funds, meaning that investors as a group withdrew more money than they put in.

That has happened even though the stock market has flourished over the last two years as it bounced back from lows reached in the spring of 2009 amid worries that the recession at the time would turn into Great Depression II.

The Standard & Poor’s index of 500 stocks had a total return of 26 percent in 2009, assuming reinvestment of dividends, and is on pace to post another double-digit gain this year. If current prices hold, they will be the best back-to-back years since 1998 and 1999.

The accompanying charts show that investors took out $81 billion from such funds so far this year, significantly more than they took out in 2009 but well below the withdrawals of more than $150 billion in 2008, the year that Lehman Brothers failed and the credit crisis blossomed.

The withdrawals this year were partly offset by money flowing into foreign stock funds and hybrid funds, which invest in both stocks and bonds. Investors seem willing to trust in overseas markets more than in the American one, and a growing number are choosing so-called target-date funds, in which fund companies promise to choose the right mix of stocks and bonds depending upon when an investor expects to retire.

Source: The New York Times

The change in the attitude of U.S. investors towards foreign stocks is good. Since the U.S. is no longer the engine that drives the global economy it is about time that Americans take advantage of growth occurring elsewhere.

Related ETFs:

iShares MSCI Emerging Markets Indx (EEM)
Vanguard Emerging Markets ETF (VWO)
SPDR S&P 500 ETF (SPY)
SPDR STOXX Europe 50 ETF (FEU)

Disclosure: No Positions