Sectors to Invest in as the Dollar Continues to Plummet

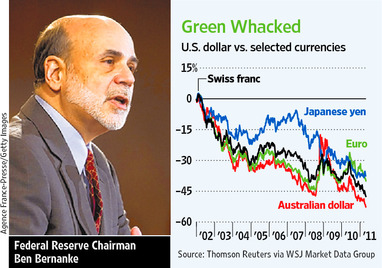
The U.S. dollar has been on a downward spiral for many years now. The following chart makes it clear the severity of the dollar’s plunge against major currencies since 2002:
dollar-plunge.jpg

Source: The Wall Street Journal

As the dollar continues to fall many investors seek the shelter in gold which has driven the price of gold to record levels. From a journal article titled How to Profit From the Shrinking Dollar:

A slumping dollar historically has been good for stocks. The classic stock play during periods of dollar weakness is large-cap companies that export heavily: Companies in the S&P 500 index derive nearly half of their revenues from abroad, notes Howard Silverblatt, senior index analyst at Standard & Poor’s.

Such companies benefit from a weaker dollar in two ways. In the shorter term, profits rise as companies convert their foreign sales into dollars. In the longer term, their products become more competitive in overseas markets, boosting revenue as well.

Barry Knapp, U.S. equity portfolio strategist at Barclays Capital, says big stocks are poised to outperform. He points to the fourth quarter of 2003, when the Federal funds rate hovered at 1%, triggering inflation fears that sent the dollar down 5.8%. The large-cap S&P 500-stock index surged 11.6%.

Large-cap technology companies usually see an uptick in their stock price when the dollar flails, says Emily Sanders, chief investment officer at Norcross, Ga.-based Sanders Financial Management Inc. Of the 10 sectors in the S&P 500, information technology generates the highest proportion of revenues outside the U.S.—an average of 57%, notes Ms. Sanders.

She says she especially likes International Business Machines Corp., whose sales increased 8% during the first quarter, with more than one-third of the gain coming from a weakening dollar. Most of her clients own the company in their portfolios.

The surprise lately has been the performance of small and midcap companies—those with market valuations of less than $5 billion. During the past 120 days, midcaps have seen their “correlation” with the ICE US Dollar Index—the degree to which the two trade together—fall to minus-0.76 from minus-0.55. (A correlation of 1.0 means two assets trade in perfect lockstep; a correlation of minus-1.0 means they trade in perfect opposition.)

Small caps—companies with an average market value of less than $1 billion or so—have seen their dollar correlations fall to minus-0.68 from minus-0.53. Large caps’ correlation fell only slightly to minus-0.69 from minus-0.64.

In other words, as the dollar has weakened, midcaps have risen the most: The S&P Midcap 400 index has jumped 12% during the period, while the S&P Small Cap 600 has gained 10% and the S&P 500 is up 8.2%.

In a declining dollar environment which sectors of the equity market offer the best opportunities?

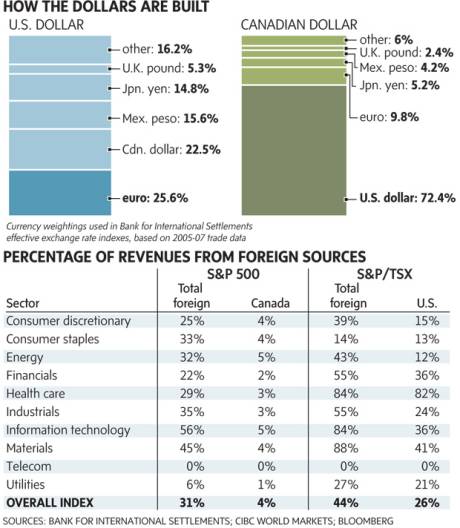
Stocks in the Technology and Materials sectors are the most attractive in the current situation as they have the highest overseas revenues as shown in the graphic below:
falling-us-dollar.jpg

Source: The Globe and Mail

Related ETFs:

  • iShares Dow Jones U.S. Basic Materials Sector Index Fund (IYM)
  • iShares Dow Jones U.S. Technology Sector Index Fund (IYW)
  • iShares S&P 500 Index Fund (IVV)

Disclosure: No positions
Which Countries Are Most Impacted By Rising Food Prices?

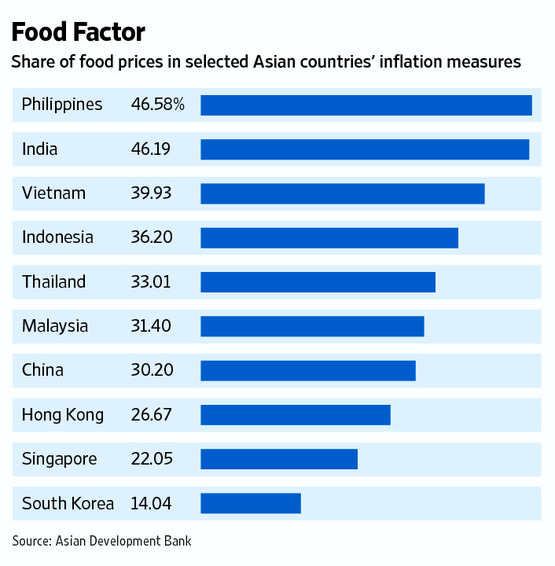
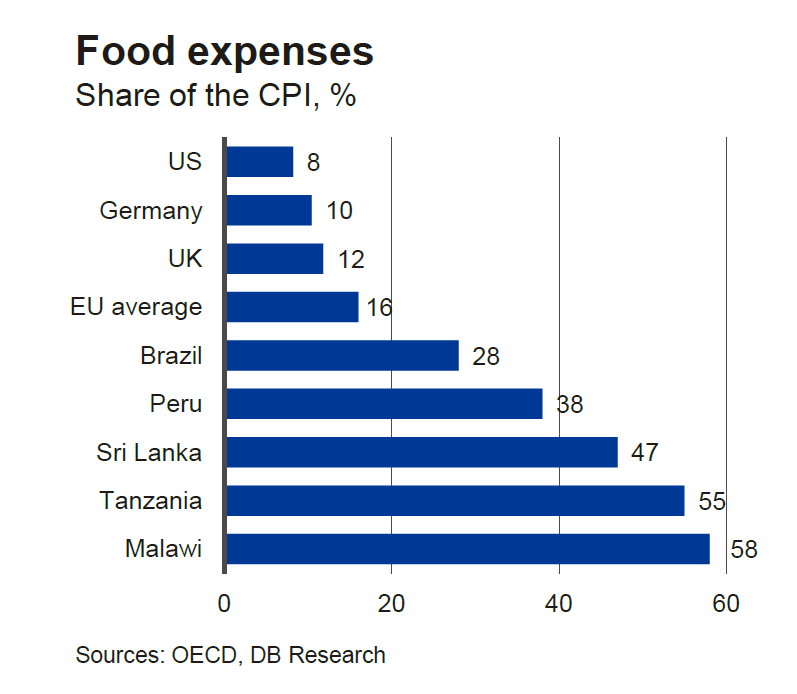
Rising food prices heavily affects low-income countries than developed markets. The following chart shows the food expenses share of the Consumer Price Index (CPI) for a few countries:

Click to enlarge

food-expenses-cpi.png

Source: Rising food prices – Short-term drivers, trends, implications, Deutsche Bank Research

From an article titled Asia Price Rises Imperil Growth in The Wall Street Journal:

Unchecked increases in oil and food prices could shave growth across Asia over the next two years, according to a report by the Asian Development Bank, imperiling economic gains among the poor in the globe’s fastest expanding region.

food-prices-cpi.jpg

The ADB report warned Tuesday that if fuel and food prices continue to rise at their current pace, inflation could shave between 0.4 and 1.5 percentage points off gross domestic product in each of Asia’s largest developing economies this year and next, including in China and India. Barring such price rises, the intergovernmental bank expects growth in the region overall to be 7.8% this year. Inflation has become the dominant economic challenge in the region, prompting widespread monetary tightening and other measures, such as price caps, fuel subsidies and tariff reductions. Several countries, including China, Indonesia and South Korea have allowed their currencies to strengthen recently, making imported goods, especially commodities, more affordable.

Inflation continues to accelerate despite these measures. This week, Vietnam announced its April inflation rate hit 17.5% compared with a year earlier, the fastest rate in over two years, as increased supplies and attempts by the government to cool lending failed to halt the rise in food and fuel prices.

Food prices, which account for 40% of Vietnam’s inflation measure, rose 4.5% in April alone.

The takeaway for investors is that governments in emerging markets will try to rein in on inflation by raising interest rates which will adversely affect equity markets

11 Canadian Non-Financial Dividend Aristocrats To Consider

I have written about investment opportunities in Canada many times before.Many others have written on the same topic as well. More recently Seeking Alpha published an excellent piece by Joseph L. Shaefer of Stanford Wealth Management, LLC.

In this post let me list some of the top dividend stocks of Canada. These stocks are part of the S&P/TSX Canadian Dividend Aristocrats Index. Components of the index must satisfy the following criteria:

1.The company’s security is a common stock or income trust listed  on the Toronto Stock Exchange and a constituent of the S&P Canada  Broad Market Index (BMI).
2.The security has increased ordinary cash dividends every year for at least five consecutive years.
3.The float-adjusted market capitalization of the security, at the time of the review, must be at least C$ 300 million.

Some of the Canadian dividend aristocrats trading on the organized U.S. exchanges are listed below with their current dividend yields:

1.Company: TransCanada Corp (TRP)
Current Dividend Yield: 4.06%
Sector:Natural Gas Utilities

2.Company: TELUS Corp (TU)
Current Dividend Yield: 4.33%
Sector: Telecom

3.Company: Shaw Communications Inc (SJR)
Current Dividend Yield: 4.59%
Sector:Broadcasting & Cable TV

4.Company: Enbridge Inc (ENB)
Current Dividend Yield: 3.08%
Sector: Oil Well Services & Equipment

5.Company: Thomson Reuters Corp (TRI)
Current Dividend Yield: 3.09%
Sector:Printing & Publishing

6.Company: Canadian National Railway Co (CNI)
Current Dividend Yield: 1.78%
Sector: Railroads

7.Company: Tim Hortons Inc (THI)
Current Dividend Yield: 1.44
Sector:Restaurants

8.Company: Canadian Pacific Railway Ltd (CP)
Current Dividend Yield: 1.67%
Sector: Railroads

9.Company: Talisman Energy Inc (TLM)
Current Dividend Yield: 1.04%
Sector:Oil & Gas Operations

10.Company: Cameco Corp(CCJ)
Current Dividend Yield:1.39%
Sector:Metal Mining

11.Company: Canadian Natural Resources Ltd (CNQ)
Current Dividend Yield: 0.80%
Sector:Oil & Gas Operations

Note: Yields noted are as of April 28, 2011

Disclosure: Long CNI

The Five Best and Worst Performing Foreign Bank Stocks YTD

The five best performing foreign bank stocks trading as sponsored ADRs in the organized exchanges and OTC markets are listed below together with their current dividend yields:

1.Bank: Swedbank (SWDBY)
YTD Change: 37.98%
Current Dividend Yield: 1.73%
Country: Sweden

2.Bank: ING Grope (ING)
YTD Change: 33.81%
Current Dividend Yield: N/A
Country: The Netherlands

3.Bank:Banco Bilbao Vizcaya Argentaria, S.A. (BBVA)
YTD Change: 24.48%
Current Dividend Yield: 6.76%
Country:Spain

4.Bank:Intesa Sanpaolo SpA (ISNPY)
YTD Change: 22.69%
Current Dividend Yield: 3.35%
Country: Italy

5.Bank:BNP Paribas (BNPQY)
YTD Change: 21.78%
Current Dividend Yield: 2.36%
Country: France

The five worst performing foreign bank stocks are:

1.Bank: Banco Macro S.A. (BMA)
YTD Change: -27.09%
Current Dividend Yield: 2.43%
Country: Argentina

2.Bank: Creditcop (BAP)
YTD Change: -25.54%
Current Dividend Yield: 2.20%
Country: Peru

3.Bank: Commerzbank AG (CRZBY)
YTD Change: -14.40%
Current Dividend Yield: N/A
Country: Germany

4.Bank:Banco Santander (Brasil) S.A. (BSBR)
YTD Change: -11.40%
Current Dividend Yield: 3.34%
Country: Brazil

5.Bank:BBVA Banco Frances S.A. (BFR)
YTD Change: -11.38%
Current Dividend Yield: 10.81%
Country: Argentina

Note: Data noted above are as of market close April 27, 2011

Disclosure: Long ING, BMA, CRZBY, BBVA, SWDBY

Who Pays More Taxes in the U.S.- Corporations or Individuals?

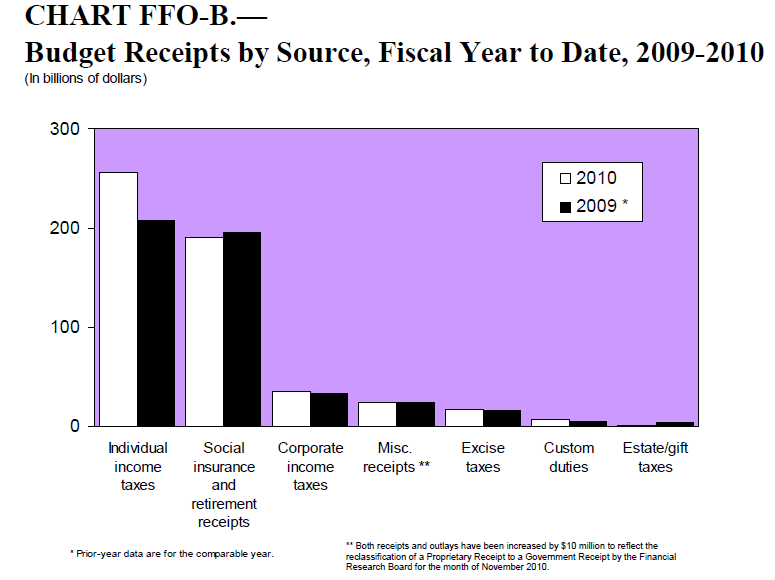
The chart below answers the question in the title of this post:

us-corporate-personal-taxes.png

Source: Treasury Bulletin March 2011. U.S. Department of the Treasury

From the report:

Individual income tax receipts, net of refunds, were $256.0 billion for the first quarter of fiscal year 2011. This is an increase of $48.3 billion over the comparable prior year quarter.

Net corporate income tax receipts were $35.9 billion for the first quarter of fiscal year 2011. This is an increase of $2.0 billion compared to the prior year first quarter.

Over the past few decades corporations have paid lower and lower taxes each year while individual income taxes have accounted for a larger portion of the Federal receipts.