Want to Invest in China? Consider These Nine Chinese ADRs

China is one of the most risky places to invest among the major emerging markets. Though the country follows the capitalist form of economic model in the past few decades, communism remains as only the political system in China. This “Market Socialism” form of government works well in some areas such as  providing affordable housing, uplifting of the poor to middle-class, world-class infrastructure for the masses, etc. However in some areas it does not. For example, as the government is heavily involved in all forms of the economy including the running of companies under state-control transparency in accounting and other information needed by investors is not readily available.

In recent years many Chinese firms have listed their shares on the US and other global markets taking advantage of investors’ craze towards all things China. However many of these stocks have not performed well and some are trading well below their IPO prices. Of the 118 exchange-listed ADRs, the majority of them are in the negative territory year-to-date.

This year many Chinese stocks trading on the US markets have been halted or suspended trading including the NYSE-listed Longtop Financial Technologies Ltd(LFT) in May as investors unearthed fraud in their earnings statements. In June, shares of Hong Kong-based Sino-Forest Corp, a forestry company plunged on the Toronto Stock Exchange where it was listed after a research note by the independent research firm Muddy Waters that questioned the company’s assets and basically called the company “a multi-billion dollar ponzi scheme”.

Despite such issues with Chinese companies some investors are still attracted to China due to its economic growth potential. An article in The Wall Street Journal today discussed about pros and cons of investing in China and some ways to invest there.

From Why China Looks Like a Buy :

Buy dividend-paying stocks.One way to reduce the risks of accounting blowups wrecking your portfolio is to buy companies that pay dividends. A 2005 study of U.S. companies by Judson Caskey and Michelle Hanlon of the University of Michigan found that while the fact that a company pays a dividend didn’t eliminate the chance of accounting fraud, it greatly reduces the odds.

If U.S. history is a guide, Chinese dividend-paying stocks could be especially attractive now. Dividend payments were one of the ways that U.S. investors knew they could trust the financials of U.S. companies in the days before the U.S. Securities and Exchange Commission and regulations requiring detailed financial disclosures, says Sam Katzman, chief investment officer at Constellation Wealth Advisors LLC in New York. “If they pay a dividend, it’s an argument that they’re not playing with their accounting,” Mr. Katman says. “That’s where the U.S. was and that’s where the Chinese are now.”

Chinese companies seem eager to win investors’ trust. Of the 147 companies in the MSCI China index, 89% pay a dividend. Despite making up just 12% of the MSCI AC Asia Pacific index market cap, China accounted for 28% of the total dividends paid out, only slightly less than Japan.

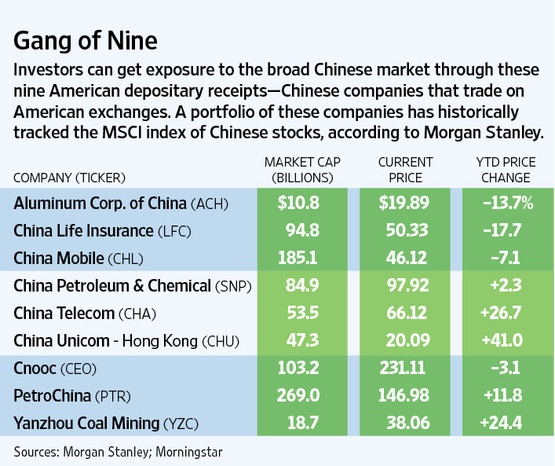
Another option is to try to replicate the index without the financials. A June analysis performed by Adam Parker, chief U.S. equity strategist at Morgan Stanley, found that a portfolio of nine Chinese American depositary receipts—China Mobile, Cnooc, PetroChina Co., China Unicom (Hong Kong) Ltd., China Life Insurance Co., China Petroleum & Chemical Corp., Yanzhou Coal Mining Co., Aluminum Corp. of China and China Telecom Corp.—have reliably tracked the MSCI China index since 2004, with a relatively steady correlation of 0.8 (a correlation of 1.0 means assets trade in lockstep). The portfolio has just 3.7% allocated to financials, compared with 35.8% for the MSCI China index.

CNOOC Ltd (CEO) is one of the largest integrated Chinese oil and gas companies with a market capitalization of about $103 billion. China Petroleum & Chemical Corporation aka Sinopec Corp. (SNP) and PetroChina Co Ltd (PTR) are smaller energy firms with market caps of about $16 billion and $31 billion respectively. Both the ADRs have dividend yields of over 3%. Except China Life Insurance Co Ltd (LFC), all the other eight companies noted above are in the non-financial sectors. Since Chinese banks have large exposures to the real estate industry, the above companies are excellent choices for investors looking to invest in China.

Disclosure: No positions
Food Poverty in the U.S. – Then and Now

The U.S. economy grew tremendously after the Second World War. Most Americans benefited from this prosperity with the middle-class enjoying steady growth in income and was able to afford of many simple luxuries of life such as home, car, education, etc. However there was always pockets of poverty.

A few years ago The World Bank staffer John Nellis commented:

A joke on the streets of Moscow these days: “Everything the Communists told us about communism was a complete and utter lie. Unfortunately, everything the Communists told us about capitalism turned out to be true.

The following is a propaganda posters from the former USSR:

Click to enlarge

Translation:

“About 20 millions of American people don’t have enough money to buy more than 1 liter of milk per month and 6 kg of meat per year.

They have plenty of goods for rich people only, and we are going to give goods to all the people.”

Image: Courtesy of Russia Travel Blog

In 1957, the U.S. population was 171,984,130. If the above information from communists was true, then about 12% of Americans at that time were unable to afford food.

Uncle Sam’s welfare program called as the “relief” program fed millions of Americans during the Depression. In 1943, the program was eliminated  as the country recovered strongly from years of war spending. In 1961, Congress enacted a pilot program named as the Food Stamp Program to help both poor people and farmers.

From an article on Food Stamps:

After President Kennedy’s assassination, President Johnson requested Congress to make the program permanent. They did in 1964. Congress estimated that the program might serve only four million people, but it grew quickly.

  • By April 1965, half-a-million poor people were buying food stamps.
  • By March 1966, that number reached 1 million.
  • By October 1967, it reached 2 million.
  • By February 1969, it reached 3 million.
  • By February 1970, it reached 4 million.
  • By March 1970 – only one month later – it reached 5 million.
  • By February 1971, it reached 10 million.
  • By October 1974, it reached 15 million.

Source: http://www.livinghistoryfarm.org

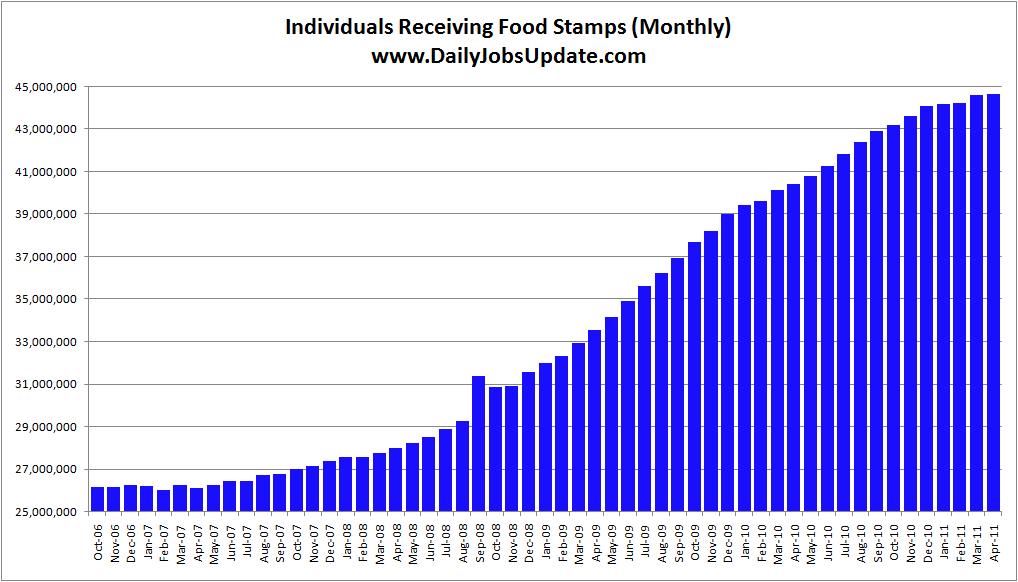
The chart below shows the number of Americans receiving food stamps over the past four years:

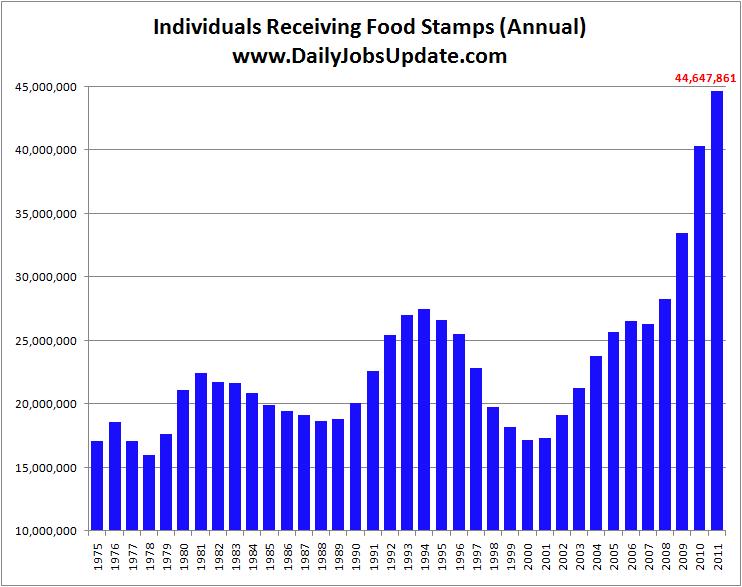
The following chart shows the annual totals from 1975:

Source: The Daily Jobs Update

From Some 43 Million Use Food Stamps in The Wall Street Journal dated February 2, 2011:

Nearly a year and a half into the economic recovery, some 43.6 million Americans continued to rely on food stamps in November.

More than 14% of the population drew food stamps in November to purchase groceries as high unemployment and muted wage growth crimped budgets. The number of recipients was up 0.9% from October, according to the new report by the U.S. Department of Agriculture. Compared to a year ago, the number of people receiving food stamps was up 14.2%.

In both Washington, D.C. and Mississippi more than a fifth of residents received food stamps — the highest recipiency rates of any state.

In summary, in 1957 about 12% of the U.S. population were food insecure. The current population of the U.S. is 311,777,095. With about 44 million dependent on food stamps for survival, the ratio works out to about 14%. So despite many years of economic growth more Americans depend on the government now to put food on the table than before.

A Historical Look at U.S. Debt

The political drama for raising the US debt ceiling continues for many days now. From a Bloomberg news report:

President Barack Obama, pressing congressional leaders for a multi trillion-dollar agreement in deficit-cutting talks “running out of time,” dismissed a plan that House Republicans will promote as not “serious.”

As negotiators near an Aug. 2 deadline for raising the U.S. debt ceiling, the president is relying on the pulpit of news conferences to hold lawmakers to his challenge for a major deal. Yet time is working against leaders as talks carry into another week, with House Republicans planning to vote next week on legislation to limit spending and tie a $2.4 trillion increase in the debt ceiling to a constitutional amendment to balance the budget, a plan standing little chance in the Senate.

“The American people are not interested in the reality TV aspects of who said what and did somebody’s feelings get hurt,” Obama said at his second news conference of the week, after stalled talks at the White House. “They’re interested in solving the budget problem and the deficit and the debt.”

As the debate goes on between Democrats and Republicans on how to solve the gridlock on this issue, lets take quick look at the US debt from a historical perspective.

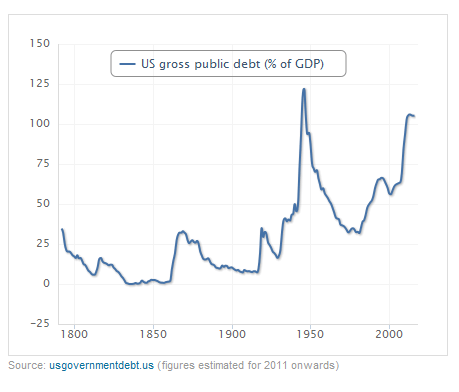
The chart below shows the US debt as a percentage of GDP since 1776:


Source: Smart Investor: The great American debt, CityWire UK

Some key points from the article:

  • Debt as a proportion of GDP was about 35% in 1780, just after the US had fought off the British in the War of Independence.
  • During the American Civil War the ratio of debt to GDP rose back to 35%.
  • The ratio spiked to 35-40% at the time of the First World War.
  • During the Second World War the debt reached the highest peak in history from less than 50% of GDP in 1939 to more than 120% in the mid-1940s.
  • In 1980, the debt was around 35-40%.But it has skyrocketed back to over 100% of GDP since President Ronald Reagan, Bush Senior, Bush Junior and now Obama, have all run budget deficits to maintain growth.
  • Compared to the above presidencies, under the reign of Bill Clinton the debt to GDP ratio actually fell.

While in the past, the US economy experienced expansion after the end of wars, in the current situation the economy is undergoing contraction since the U.S. is involved in multiple wars simultaneously with no end in sight.

On a related note, the Total Public Debt Outstanding stands at $14,342,953,885,641.98 as of July 14, 2011 according to U.S. Department of the Treasury.

Performance Comparison: Peru and Colombia Top Brazil

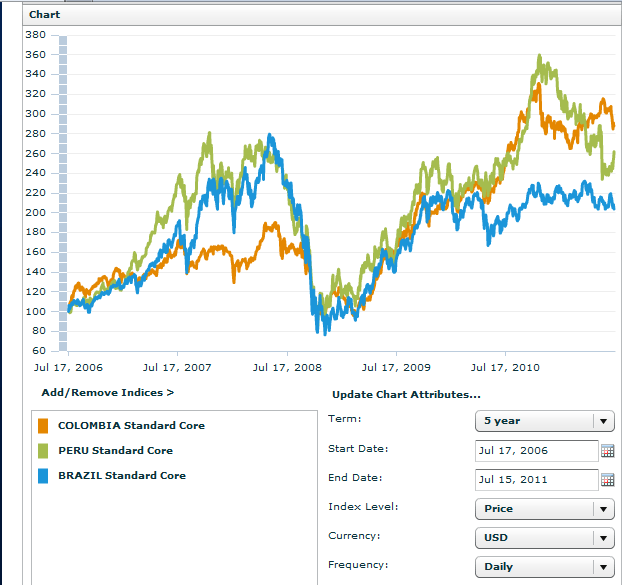
Brazil is one of the perennial favorite emerging market destination for many investors. However in terms of equity market performance, the smaller Latin American economies of Peru and Colombia beat Brazil over the 5-year term.

In a recent Trustnet (UK) article Fidelity manager Alex Duffy noted:

“Despite the fact that Brazil is the largest economy in LatAm, it has actually only been the best performing market twice in the past 10 years,” the manager explained.

“Colombia and Peru have delivered consistent returns at far lower volatility than Brazil.”

The following chart shows the 5-year performance of MSCI indices for Peru, Colombia and Brazil:


Source: MSCI

The MSCI indices for Colombia and Peru has clearly outperformed Brazil in five years in US dollar terms. Though Brazil is home to some of the top companies in Latin America, better performing companies exist in other countries such as Chile, Colombia, Peru, etc. Two such companies are Peru’s Compania de Minas Buenaventura (BVN) and Colombia’s Ecopetrol (EC).

The key takeaway from this post is that it is always not a good idea to follow where the hot money is flowing into. This is especially true with respect to selecting and investing in emerging markets.

Related ETFs:

iShares MSCI Brazil Index (EWZ)
iShares MSCI All Peru Capped Index (EPU)
Global X FTSE Colombia 20 ETF (GXG)
Market Vectors Colombia ETF (COLX)

Disclosure: No Positions

List of Countries With Which the US Has Tax Treaties

When investing in foreign stocks one of the factors that investors should take into consideration is the tax treatment of dividends earned. To that end, earlier this year I wrote an article on Withholding Tax Rates by Country for Foreign Stock Dividends.

Similar to other countries, the U.S. also has income tax treaties with many countries to avoid double taxation of dividends and other income earned by US citizens. In addition these treaties also offer other favorable tax treatments to investors in order to stimulate investment between each countries and allow free flow of capital. In general, it is a wise idea to invest in countries with which the U.S. has tax treaties.

From the IRS site:

The United States has tax treaties with a number of foreign countries. Under these treaties, residents (not necessarily citizens) of foreign countries are taxed at a reduced rate, or are exempt from U.S. taxes on certain items of income they receive from sources within the United States. These reduced rates and exemptions vary among countries and specific items of income. Under these same treaties, residents or citizens of the United States are taxed at a reduced rate, or are exempt from foreign taxes, on certain items of income they receive from sources within foreign countries. Most income tax treaties contain what is known as a “saving clause” which prevents a citizen or resident of the United States from using the provisions of a tax treaty in order to avoid taxation of U.S. source income.

If the treaty does not cover a particular kind of income, or if there is no treaty between your country and the United States, you must pay tax on the income in the same way and at the same rates shown in the instructions for the applicable U.S. tax return.

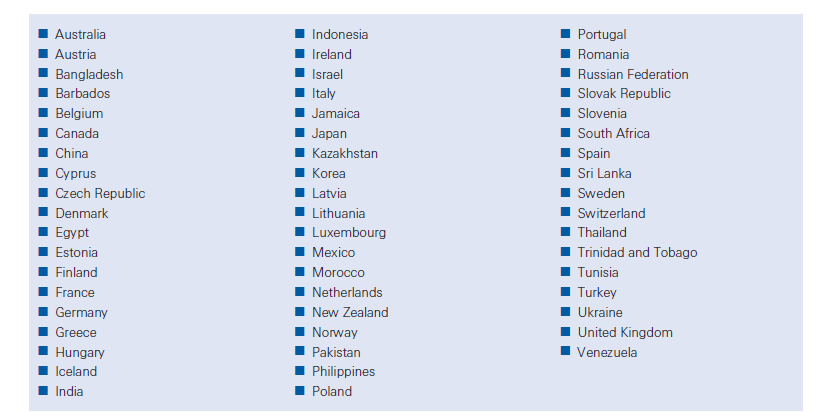
The graphic below lists countries with which the US has income tax agreements:

Note: Data shown is accurate as of 2009.

Source: US Tax Liability on 2009 Dividends, Deutsche Bank Trust Company Americas

For additional information on tax treaties between particular countries and U.S., please refer to the IRS website here.

Publication 901 (04/2011), U.S. Tax Treaties also provides the additional details.

Canadian Investors: The list of countries with which Canada has tax treaties can be found here.

Australian Investors: The list of countries with which Australia has tax treaties can be found here.