Bear Markets Are Always Followed By Positive Returns

Equity market returns after bear markets are positive and sometimes the rebound is higher than the percentage of decline. So investors with a long-term horizon can take advantage of lower stock prices when markets are in a downward trend.

The following graphic shows the cumulative equity returns once the bear market ends:

Click to enlarge

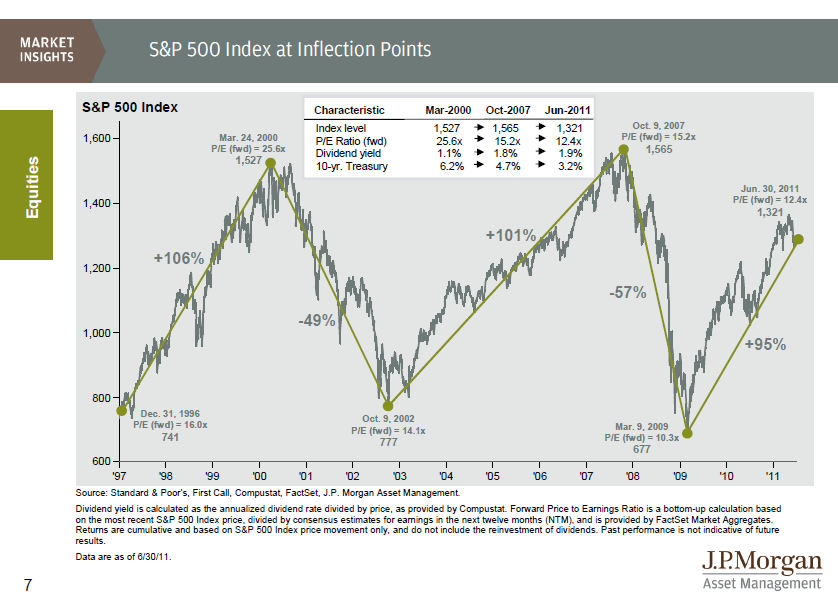
Equity prices fell about 57% during the recent bear market that ended in March, 2009. But within one year, the markets rebounded by about 67%. After reaching a peak, equity markets worldwide are again falling in recent months due to European debt crisis, lack of growth in the U.S. economy, inflation in emerging markets, etc.

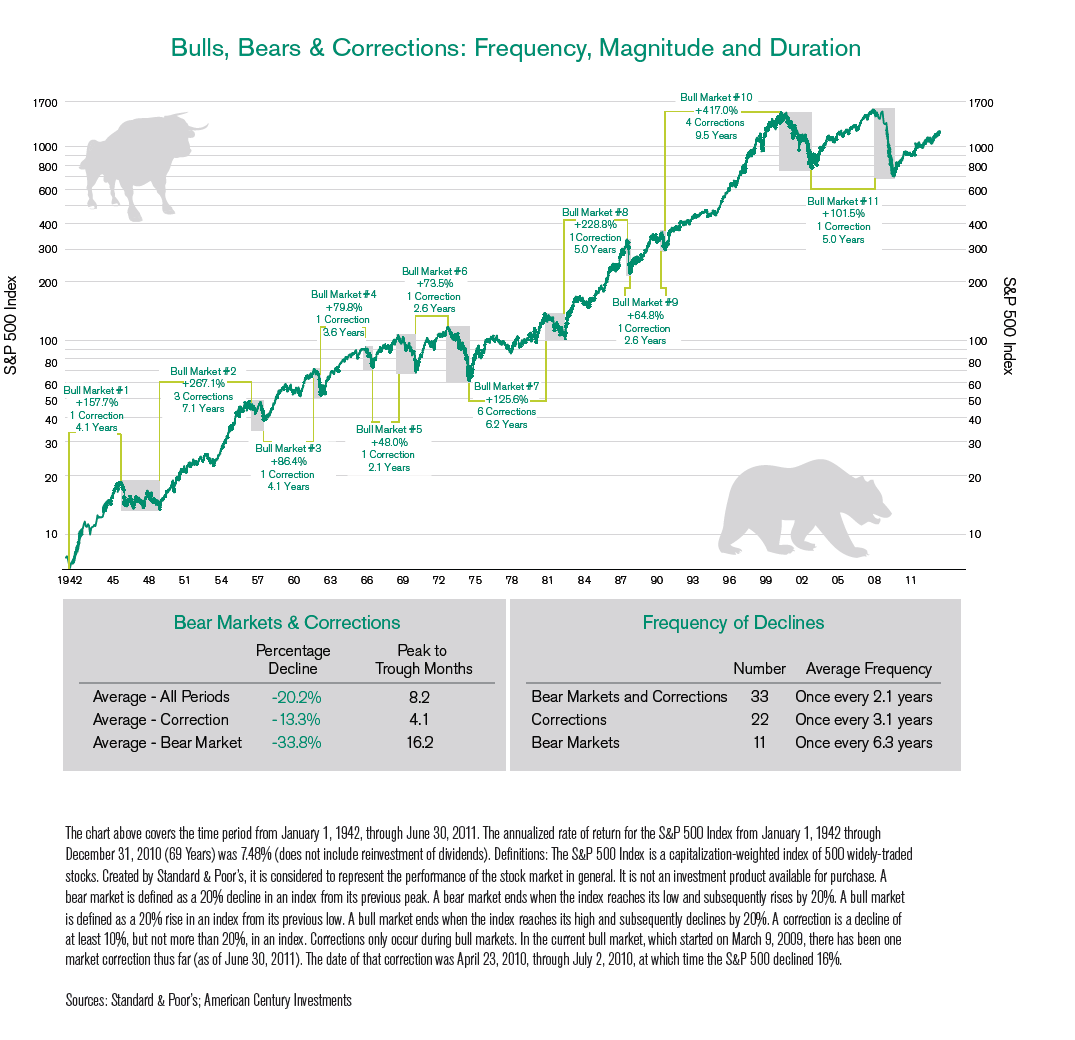
The chart below shows bull markets with their duration and returns since the 1940s:

Click to enlarge

Source: Time-Tested Investment Strategies for the Long Term, American Century Investments

Related ETF:

SPDR S&P 500 ETF (SPY)

Disclosure: No Positions
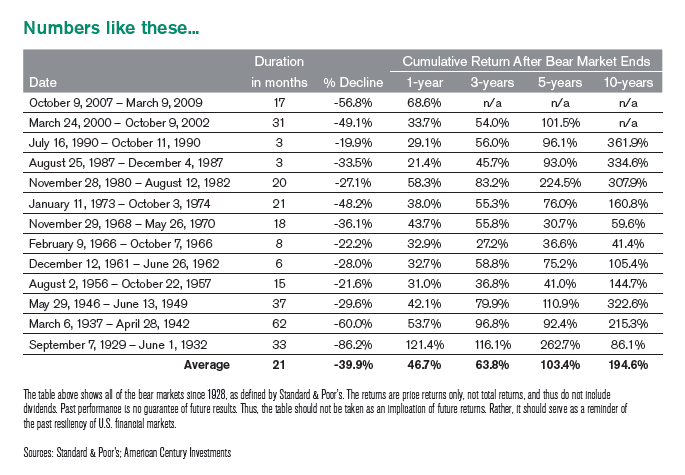
Chart: Fixed Income Sector Returns from 2001 to 2010

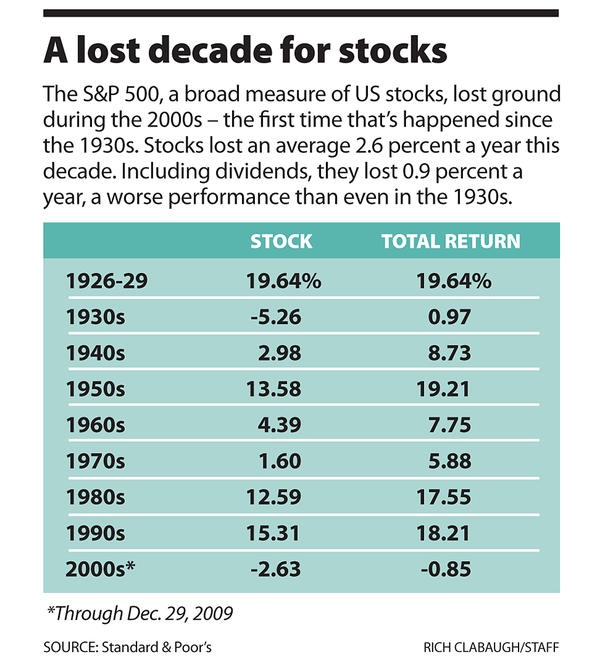
U.S. equities fared very poorly in the lost decade with the nominal S&P 500 stock price down 20% for the decade excluding dividends. The graphic below shows the performance of the S&P 500 index by decades:

Click to enlarge

Source: A lost decade for stocks. Will next one be better?, Christian Science Monitor

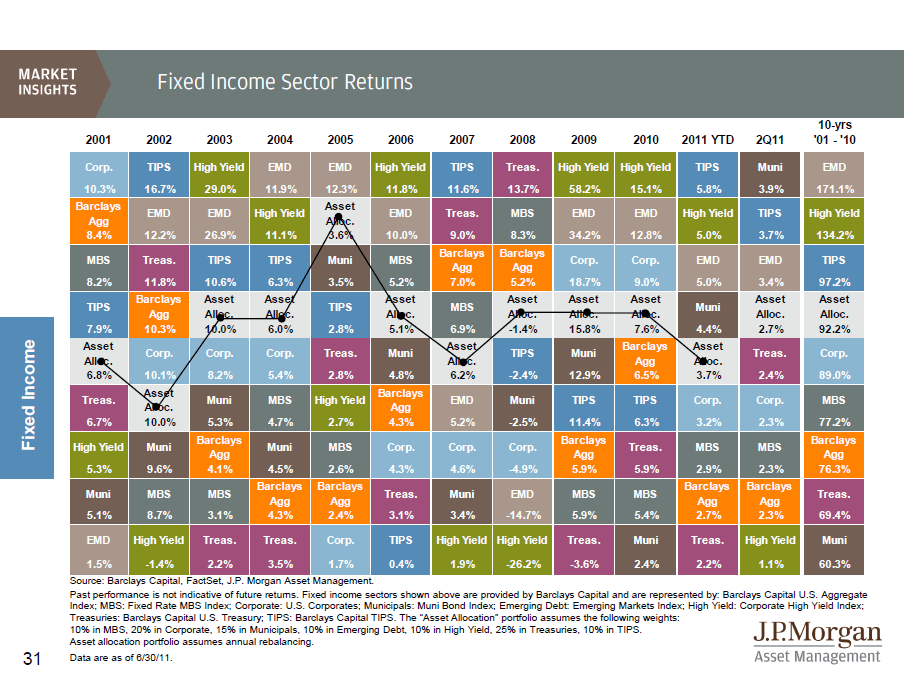
While U.S. stocks practically went nowhere in the past decade, fixed income investments performed extremely well in the period from 2001 thru 2010 as shown in the graphic below:

Click to enlarge

Source: JPMorgan Funds

For the 10-years, High yield bonds, Corporate bonds, TIPS and Munis returned 134.2%, 89.0%, 97.2% and 60.3% respectively.

The key takeaway from this post is that fixed-income should be part of a well-diversified portfolio.

Disclosure: No Positions

Review: Russell Australia High Dividend Index

One of the indices offered by the index provider Russell Investments is the The Russell Australia High Dividend Index. This index is comprised of diversified Australian blue chips that pay high dividends.

The average market cap of companies in the index is over $34 billion and the dividend yield of the index is 5.72%. Financials account for about 45% of the index.

The Top 10 holdings in the index are:

  1. BHP Billiton Ltd  (BHP)
  2. Commonwealth Bank of Australia (CMWAY)
  3. Westpac Banking Corp (WBK)
  4. National Australia Bank Ltd (NABZY)
  5. Australia New Zealand Banking Group Ltd (ANZBY)
  6. SP AusNet
  7. Woolworths Ltd
  8. Tatts Group Ltd
  9. Wesfarmers Ltd
  10. Metcash Ltd

The Russell High Dividend Australian Shares ETF tracks the performance of this index. The ETF trades on the Australian Stock Exchange under the ticker RDV. The list of 53 components of this ETF can be found here.

Disclosure: No Positions

Ordinary Investors Should Not Try To Time The Markets

Equity markets fall and rise for a multitude of reasons that no one can predict. So investors should not try to time the market moves. This is especially important for ordinary investors. Sophisticated professional investors such as hedge funds and other traders are able to reap fantastic profits from taking advantage of volatility in the markets but even some of the fail when the strategy backfires.

Click to enlarge

Source:  JPMorgan Funds via The Big Picture

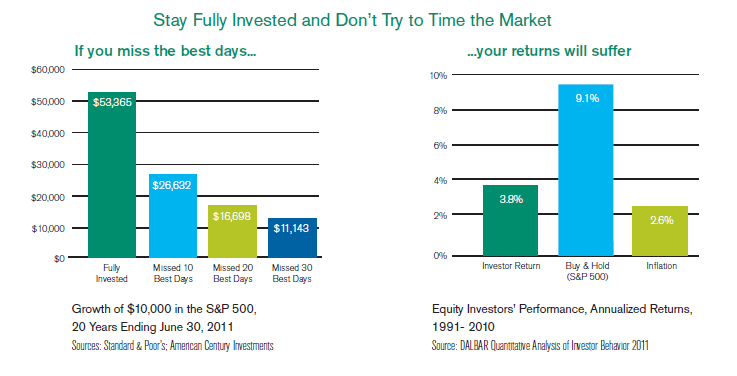
To take advantage of the market gains, one is better off staying fully invested as opposed to repeated buying and selling. As no one can predict the movement of equity markets, even missing out a few days can lower one’s return substantially as shown in the graphic below. However it should also be noted that even staying fully invested does not guarantee a profit.

Source: Time-Tested Investment Strategies for the Long Term, American Century Investments

Related ETF:

SPDR S&P 500 ETF (SPY)

Disclosure: No Positions
U.S. Household Debt: A Major Impediment To Any Economic Recovery

The size of the U.S. economy is about $14.66 Trillion. However over 70% of the GDP is based on consumption spending. As a result any recovery is highly dependent on the U.S. consumer whose household debt is still too high by historical standards. This is in sharp contrast to U.S. companies which hold over $1.0 Trillion in cash and cash equivalents on their balance sheets. With the official unemployment rate at 9.1% in August, millions of unemployed Americans are unable to contribute much to an economic recovery due to reduced spending.

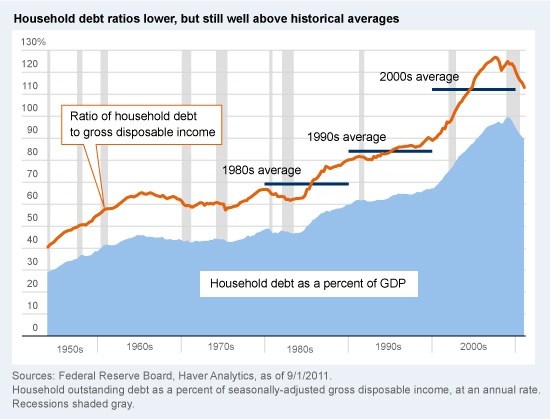
According to a Federal Reserve Bank study, the U.S. ratio of household debt-to-disposable income was 147.2% during the third quarter of 2010. This is still higher than historical averages as shown in the following graph:

Source: The albatross on economic growth, Fidelity Investments

From the research article:

After peaking at $13.9 trillion in the first quarter of 2008, overall household debt has fallen by $608 billion—but what really matters is household debt relative to personal income. Measuring debt levels relative to a person’s income gives a better indication of the capacity to spend. Using the ratio of total household debt to gross disposable income, it is striking how quickly the average household piled on debt in the 2000s.7

From 1952 to 1979, the average ratio of household debt to gross disposable income was 57%, but over the past three decades the averages steadily, and then dramatically, climbed higher. In the 1980s, it averaged 69%; in the 1990s it averaged 84%; but then the housing boom hit in the 2000s and the ratio skyrocketed to an average of 112%. The ratio ultimately peaked in Q3 2007 at 127%, right before the onset of the recession.8

While the household-debt-to-disposable-income ratio has come down to 113%, there is still a way to go to reach the lower levels of the 1980s or ’90s. Given the level of gross disposable income at the end of Q1, overall household debt would need to fall another $3.4 trillion to match the average debt-to-disposable-income ratio of 84% from the 1990s.

It will be a long slog to get household debt back to more sustainable levels—a process made all the more difficult and painful by the slow growth in personal income. As long as household debt levels remain high, deflationary pressures will likely remain a headwind to consumer spending, and thus to economic growth.