The Global Wealth Pyramid

The world population crossed the 7 billion mark this year. The majority of this population lives in the developing world. According to The Global Wealth Report published last by Credit Suisse last year, about 92% of the world’s population can be classified as part of the middle, the upper middle and the lower classes. The 334 million in the upper middle class presents a large group for significant earnings growth potential for the banking industry. The Occupy protest movement in the US and other the developed countries is a manifestation of the class struggle between those at the bottom of the pyramid (the 99%) vs. those at the top of the pyramid (1%).

The Global Wealth Pyramid

Click to enlarge
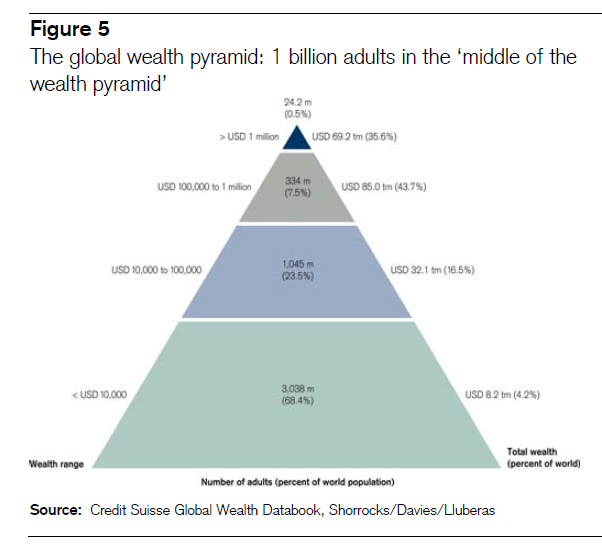
 

Source: The Global Wealth Report, The Credit Suisse Research Institute
U.S. Stock Market Volatility Since 1928

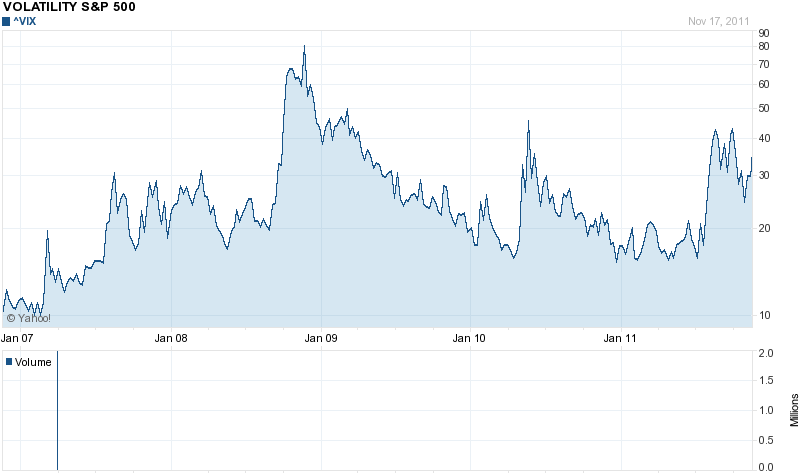
Volatility in the U.S. stock market has been extreme in the past few years. The following chart shows the 5-year chart for the VIX index:

Click to enlarge

Source: Yahoo Finance

After peaking in late 2008, the fear index started to moderate until the middle of this year after which it has spiked again due to the European debt crisis and other factors.

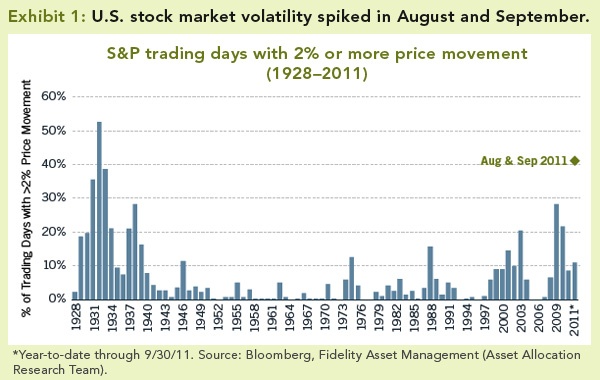
A research report by Fidelity notes that more recently markets are driven mostly by macro issues. The following chart shows the volatility in the S&P 500 since 1928:


Source: Macro-driven markets: What asset prices are signaling, Fidelity Investments

From the Fidelity report:

In August and September, asset prices fluctuated wildly: Over 40% of the trading days in the U.S. stock market experienced either up- or downswings of more than 2%—a degree of instability similar to the 1930s (see Exhibit 1, below). This volatility could be attributed to a limited number of factors, implying that investors were reacting to the same small set of phenomena. It was driven primarily by macro uncertainties, in particular, the eurozone financial turmoil and the U.S. government debt ceiling debate. The volatility was further exacerbated by the dominance of short-term and index-oriented trading—including high frequency trading, program trading, and ETFs—that triggered sharp moves among broad baskets of securities.

High volatility in the markets is not beneficial to long-term investors but is a boon to short-term traders. Strong fluctuations in equity prices also confirm investors’ lack of confidence in holding equities for the long-term.

Related ETF:

SPDR S&P 500 ETF (SPY)

Disclosure: No Positions

The World’s 10 Largest Known Natural Gas Fields

Natural Gas is increasingly becoming an important fuel in meeting the global energy needs. In this post, let us take a quick look at the largest natural gas fields in the world.

Eastern Europe and Eurasia have the largest known natural gas resources, which are concentrated in the countries of the former Soviet Union. The Middle East also holds large volumes of natural gas due to the presence of oil. More than half of the world’s proven reserves are concentrated in Russia, Iran and Qatar in large conventional fields.

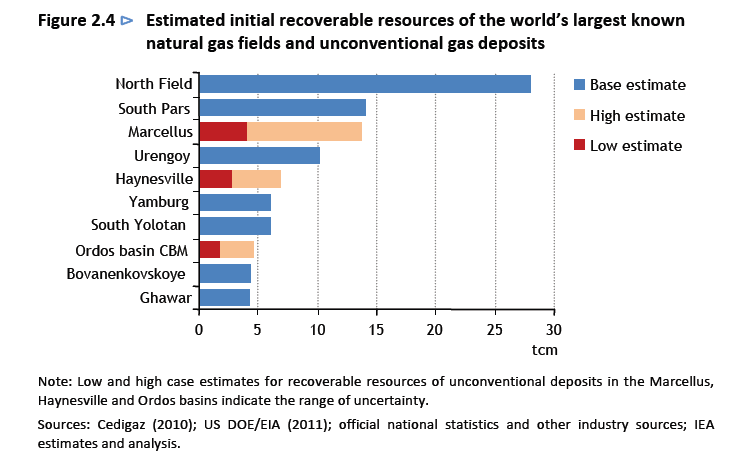
The following chart shows the World’s Ten Largest Known Natural Gas fields:

Click to enlarge

Based on assumptions of recovery and extent of deposits, Marcellus and Haynesville, two of the largest identified fields in the United States, rank respectively as the the third and fifth-largest fields gas fields in the world.

The world’s other largest fields are located in Qatar (North Field), Iran (South Pars), Russia (Urengoy, Yamburg and Bovanenkovskoye), China (Ordos basin), Turkmenistan (South Yolotan) and Saudi Arabia (Ghawar, which is also the world’s largest oil field).

Source: Are we entering a  Golden Age of Gas ?, Special Report, IEA

Update:

From Top Picks for Natural Gas Plays in Canadian Business:

Natural gas prices have a long history of dramatic rises and falls, but the last time they dropped, in 2008, it was because of a revolutionary change in the industry. Advances in drilling technology made it possible to extract gas from solid rock formations such as shale, vastly increasing the size of the reserves that could be economically recovered. Eric Nuttall, manager of Toronto’s Sprott Asset Management’s Energy Fund, says that eight years ago the average natural gas well would initially produce 250,000 cubic feet of gas per day. That number is over a million cubic feet today. The go-big-or-go-home economics of shale gas mean North American supply is far outstripping demand, even though that is increasing, too, as users switch from more expensive (oil), more polluting (coal) or more dangerous (nuclear) energy sources.

Related ETF:

The United States Natural Gas ETF (UNG)

Disclosure: No Positions

Ten European Bank Stocks To Consider

Most investors are currently avoiding European banks due to the myriads of issues facing the whole banking industry. It is almost impossible to evaluate a bank’s balance sheet since there are many known unknowns. Austria’s Erste Bank (EBKDY) is a classic example of this scenario. Just when investors, including myself, thought that the worst was over, the bank announced last month that it would lose up to 800 million Euros ($1.0 Billion) this year after taking hits on foreign-currency loans in Hungary and Euro zone sovereign debt. Erste also suspended the dividend payment for this year. As a result the already beaten down stock fell more after this confession.

In spite of all the negativity towards the European banking sector, some managers are staying bullish. In a recent interview Paul Read, Co-Head of Fixed Interest at Invesco Perpetual, UK stated the following factors supporting his views:

  • Banks have raised a huge amount of capital since the credit crisis of 2008.
  • Big banks have engaged in lots of deleveraging with the average European bank come down from 30 times leverage to 20 times leverage.
  • Quality of capital has improved.
  • Reliance of wholesale funding has decreased compared to earlier years.
  • Loan to deposit ratios have improved.

Paul said that he was bullish from an income point of view on the big northern European banks, the big US banks and the big UK banks.

Source: Risk & Reward, Research and investment strategies, 4th quarter 2011, Invesco UK

Investors willing to take some risk and planning to hold for at least five years can consider the following European bank stocks:

1.Company: Barclays PLC (BCS)
Current Dividend Yield: 3.22%
Country: UK

2.Company: HSBC Holdings PLC (HBC)
Current Dividend Yield: 4.51%
Country: UK

3.Company: Swedbank AB (SWDBY)
Current Dividend Yield: 2.48%
Country: Sweden

4.Company: Banco Santander SA (SAN)
Current Dividend Yield: 11.49%
Country: Spain

5.Company: Erste Group Bank AG (EBKDY)
Current Dividend Yield: 5.11%
Country: Austria

6.Company:Nordea Bank AB (NRBAY)
Current Dividend Yield: 5.01%
Country: Sweden

7.Company: Dnb Nor ASA (DNHBY)
Current Dividend Yield: 6.34%
Country: Norway

8.Company: Deutsche Bank AG (DB)
Current Dividend Yield: 2.82%
Country: Germany

9.Company: Credit Suisse Group AG (CS)
Current Dividend Yield: 6.32%
Country: Switzerland

10.Company:  Banco Bilbao Vizcaya Argentaria S.A (BBVA)
Current Dividend Yield: 7.95%
Country:Spain

Note: Dividends yields noted are as of market close Nov 15, 2011

Disclosure: Long STD, BBVA, EBKDY, SWDBY

Russia’s Top Import and Export Partners

Russia is a resource-rich nation and the hence the vast majority of Russian exports are fuels, metals and minerals. The country is one of the largest exporters of crude oil and natural gas with Europe being the primary market.

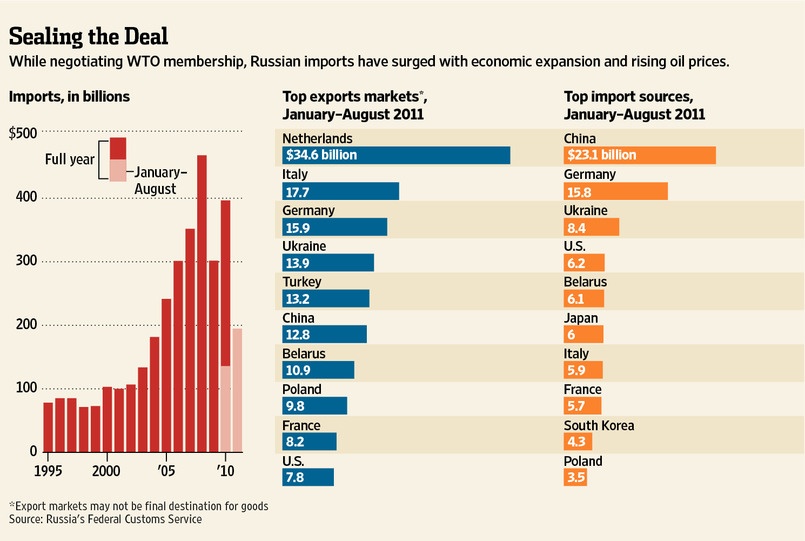
The following graphic shows the top export and import markets for Russia:

Click to enlarge


Source: Russia to Join WTO, The Wall Street Journal

Due to geographical and cultural factors, European countries have strong trade ties with Russia. China was the top import source for Russia in the period noted. Among the European countries, Russia’s two-way trade with Germany is large.

Update:

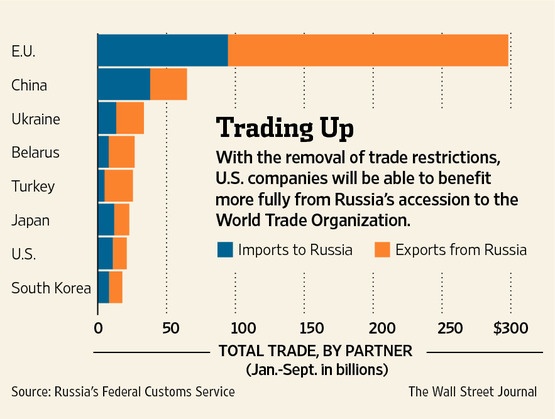
Russia’s Major Trade Partners in 2012:

Source: Lawmakers Pass Russia Trade Bill, The Wall Street Journal


Related ETF:

Market Vectors Russia ETF (RSX)

Disclosure: No Positions