Checking on Brazilian Utility ADRs

The theory that emerging markets are decoupled from developed markets did not hold well during the current turmoil in global equity markets. Emerging market stocks have also fallen sharply in tandem with others. For example, while most of European countries are down more than 20% and the S&P is down 6.5%%, Brazil’s Bovespa is also off 22.2% YTD as of September 27th.

Investors looking to add some exposure to Brazil can consider adding some of the utility stocks. Unlike their peers in the developed world, the yields of Brazilian utilities tend to fluctuate but the potential for growth are higher with them.

Brazilian electricity and natural gas companies trading on the organized US exchanges are listed below with their current dividend yields and YTD price changes:

1.Company: Ultrapar (UGP)
Current Dividend Yield: 3.54%
YTD Change: Unchanged

2.Company: Companhia Energetica de Minas Gerais-CEMIG (CIG)
Current Dividend Yield: 6.62%
YTD Change: -2.56%

3.Company: SABESP  (SBS)
Current Dividend Yield: N/A
YTD Change: -8.80%

4.Company: CPFL Energia (CPL )
Current Dividend Yield: 6.81%
YTD Change: -10.86%

5.Company: Comp. Paranaense de Energia-COPEL (ELP)
Current Dividend Yield: 1.02%
YTD Change: -25.90%

6.Company: Centrais Eletricas Brasileiras-Eletrobras (EBR)
Current Dividend Yield: 6.60%
YTD Change:  -35.49%

Some of the sponsored Brazilian utility ADRs trading on the OTC markets are listed below with their current yields:

1.Company: AES Tiete (AESYY)
Current Dividend Yield: 10.48%

2.Company: Centrais Elet. de Santa Catarina-Celesc (CEDWY)
Current Dividend Yield: 6.58%

3.Company: Comp. de Transmissao-Paulista (CTPZY)
Current Dividend Yield: 11.97%

4.Company: Comp. Energetica de Sao Paulo-CESP (CESDY)
Current Dividend Yield: N/A

5.Company: Comp. Paranaense de Energia-COPEL (ELPVY)
Current Dividend Yield: 4.49%

6.Company:Light SA (LGSXY)
Current Dividend Yield: 14.98%

7.Company: MPX Energia (MPXEY)
Current Dividend Yield: N/A

8.Company: Tractebel (TBLEY)
Current Dividend Yield: 8.68%

Disclosure: No Positions

Comparison of Developed and Emerging Market Banks on P/B Ratios

Ever since the Global Financial Crisis (GFC) of 2008, investors’ confidence in the global banking industry has declined tremendously. In the developed world, banks are still saddled with unknown losses mostly tied to real estate and derivatives despite billions of dollars pumped into them as part of the various bailout programs after the crisis.Though emerging market banks have not been crushed like their peers in the developed world, they also suffer from erosion in investor confidence and other issues like capital costs, exposure to the real estate sector, rising default rates, etc.

From the McKinsey Annual Review on the banking industry report:

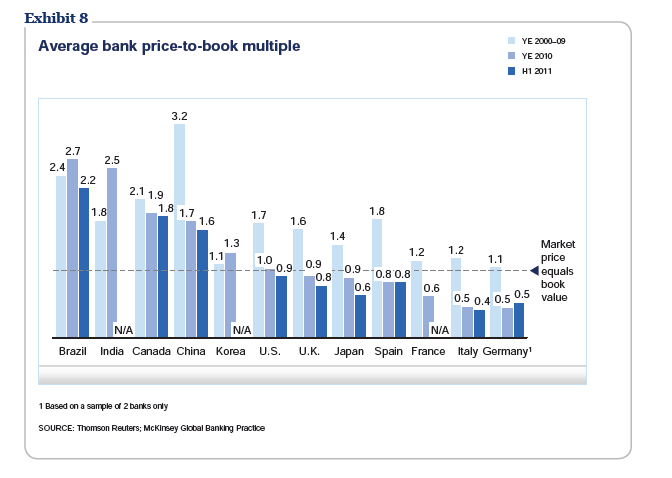
After a rebound in 2009, banks’ total market capitalization remained flat overall in 2010 and the first half of 2011, with gains in many developing markets offset by declines in the US, China, and Western Europe. In both developed and developing markets, banks’ price-to-book ratios fell sharply during 2008-09, failing to recover during 2010 or the first half of 2011. This reflected the market’s view not only that profits would remain depressed, but also that banks would struggle to remunerate their required capital (Exhibit 7). There was also continuing divergence between developed and developing market banks’ price-to-book ratios. By mid-2011, even before the recent turmoil, banks’ market prices were below their book values in several developed countries, including the US, UK, Japan, France, Italy, and Germany (Exhibit 8).

Click to enlarge

After the recent fall, some European banks have gotten cheaper based on P/B and other factors. However one has to be extremely selective. One idea is to consider to banks outside of the Euro Zone such as select Nordic banks. Among U.S. banks, some small and regional banks are worth looking into. For example, U.S Bancorp(USB) offers many compelling reasons to invest as noted in an article in The Globe and Mail. In the emerging markets, some of the bank stocks that investors can review include: Banco Santander Chile (SAN), Banco do Brasil SA (BDORY), HDFC Bank Ltd (HDB) and Malayan Banking BHD (MLYBY).

Disclosure: Long USB

The Top Six Utility Companies in UK

With the winter approaching soon, all six of the major utility firms in UK have increased prices for the second time this year, according to a report in This is Money website. Most of the price increases for electricity and gas are in the double digits.

The six major energy suppliers in the British market are:

  1. Scottish Power
  2. British Gas
  3. Scottish and Southern Energy (SSEZY)
  4. EDF Energy
  5. E.ON (EONGY)
  6. npower

EDF Energy is the British subsidiary of the France-based EDF Group (ECIFY). The company serves operates in 21 countries serving over 38 million customers in Europe, over 28 million of which is in France. Currently the ADR has a dividend yield of 6.0%. Scottish and Southern Energy (SSEZY) has a 5.60% yield. Germany-based E.ON is also one of the largest utilities in Europe. The US-traded ADR fell from over $34 earlier this year to below $18 recently. Based on yesterday’s closing price of $20.98, it pays a hefty a 10.98% dividend.

Disclosure: Long EONGY


The World’s Ten Biggest Employers

I came across an interesting article in The Economist magazine recently that discussed about the biggest employers in the world. When the economy is sluggish private sector is unable to create jobs due to the lack of demand for goods and services. For example, despite having over a Trillion dollar in cash, U.S. companies have been reluctant to invest capital and hire workers in the U.S. However it must be noted that the same companies have hired millions in other countries where labor costs are cheaper. With no or few jobs created in the private sector, trimming of public sector workers by governments adds more unemployment in the short-term but helps in the long-run.

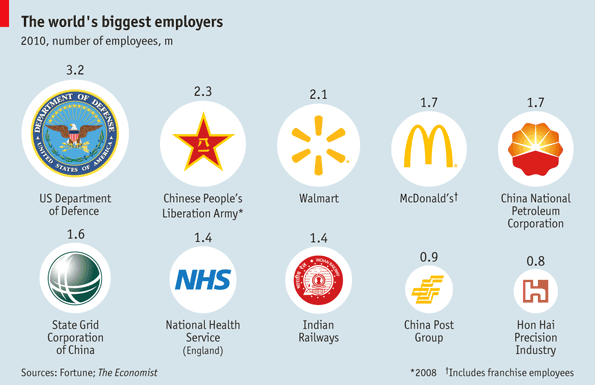
The following graphic shows the world’s biggest ten employers:

Click to enlarge

Source: The Economist

From the article:

In our chart of the ten biggest global employers, below, seven are government-run. America’s defence department had 3.2m people on its payroll last year, equivalent to 1% of the country’s population. China, the world’s most populous nation and a big military spender, employs 2.3m people in its armed forces. And the number of people working for the National Health Service in England is equivalent to over 2.5% of the country’s population. The three private companies are Walmart, McDonald’s and Taiwan’s Hon Hai Precision Industry Company, a subsidiary of which is Foxconn, a secretive electronics manufacturer.

The above chart is a little misleading since it includes military in the comparison. An ideal way to identify the top employers would be to create a separate list for the public and private sectors. The U.S. Department of Defense employing 3.2 million is not a surprise since the U.S. is the sole superpower and a large part of the economy is dependent on the military. Other than China’s Army, the three state-owned Chinese firms shown above may not be as efficient as firms in the private sector. Similarly UK’s NHS  and India’s Indian Railways suffer from atrocious inefficiency as well. The situation with the bloated public sector in UK is changing now as the Cameron government implements long-awaited reforms. Taiwan’s Foxconn is the world’s largest contract electronics manufacturer for many of the global hi-tech firms such as Apple(AAPL), Dell (DELL), etc. Foxconn employs thousands of workers in China to take advantage of the low labor costs there.

Disclosure: No Positions

How to Profit from the Explosive Growth of Global Auto Industry

The global auto population surpassed the 1 billion mark last year according to a report released last month by the auto industry consultant Ward’s Auto.

China topped the ranking with an addition of about 17 million units last year for an increase of 27.5% in registration from previous year. China has the second largest population of cars in the world after the U.S. China also accounted for nearly half of the global growth last year.

Car sales in India rose by 8.9% last year with over 20 million vehicles on the road currently. Brazil took the third place by adding about 2.5 million units. To put the China and India auto figures in perspective, the U.S. total vehicle population is over 240 million making it the home of the largest auto population in the world. The US ownership ratio stands at one car for every 1.3 Americans. On the other hand, with a population of 1.17 billion people, India has one car for every 56.3 Indians.

From its humble beginnings 125 years ago, cars have become an important pillar of the global economy today. The following excerpts are from a special report on the auto industry in Deustche Welle:

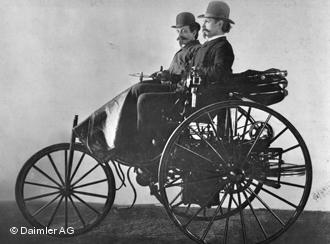
The history of the modern automobile began on Jan. 29, 1886 when engineer Carl Benz registered a patent in the city of Mannheim for his motorcar.

It was a vehicle with three wheels – called a “tricycle” on the patent application – equipped with an internal-combustion engine. The machine could generate 0.8 horsepower (0.6 kilowatts), was started with a crank and had a top speed of 18 km/h (11.2 mph).

Carl Benz (right) in his patented vehicle

Source: Deustche Welle

In the past few years soaring gas prices have forced many consumers to buy fuel-efficient cars. In addition, the demand for ethanol and electric-powered vehicles continues to increase as consumers become more educated on environmental issues. Even the notoriously green-averse Americans have joined Europeans in embracing green-friendly products. For example, a few years ago General Motors (GM) finally stopped production of the Hummer SUVs, a gas-guzzling civilian version of military Humvees.

It is fascinating to note that electric cars beat gasoline-powered cars in setting the first speed records. From the DW report:

In one of history’s little ironies, the first speed records were actually set with electric cars. In 1901, one vehicle exceeded 100 km/h (62 mph).

The gasoline-powered engine was not yet the standard, and around the turn of the century, different types of drives were still competing with one another. Manufacturing data from American producers in 1900 shows that 75 makers assembled a total of 4,192 automobiles during that year, including 1,688 steam-driven vehicles and 1,575 electric cars. Only 929 of the cars made had gasoline engines.

It took about another two decades for gasoline engines to establish themselves. But they eventually took the top spot thanks to their higher speeds, better motors, cheap fuel, and the much greater distances they could cover, especially compared to electric motors with their weak batteries.

Investment opportunities in the Auto industry:

The best way to profit from the growth in the global auto industry is to invest in companies that supply parts to automakers. This includes manufacturers of parts such as tires, sensors, chemicals, windshields, brakes, electrical systems, interiors, etc.

Ten foreign auto parts makers trading on the US markets are listed below for further research:

1.Company: Magna International (MGA)
Country: Canada

2.Company: Autoliv (ALV)
Country: Sweden

3.Company: Bridgestone (BRDCY)
Country: Japan

4.Company: Denso (DNZOY)
Country: Japan

5.Company: Michelin (MGDDY)
Country: France

6.Company: Nokian Tyres (NKRKY)
Country: Finland

7.Company: Rheinmetall (RNMBY)
Country:Germany

8.Company: Continental (CTTAY)
Country: Germany

9.Company: Valeo (VLEEY)
Country: France

10.Company: Geely Automobile (GELYY)
Country: Hong Kong

Disclosure: Long VLEEY and DNZOY