The World’s 50 Biggest Banks by Assets for 2011

The Global Finance magazine has published its annual ranking of the world’s biggest banks for this year based on total assets the end of 2010.

The top 50 banks hold assets of just over $61 Trillion. China’s banks continue to grow in size. This year, ICBC, China’s biggest bank entered the top 10 ranks by taking the 9th place.

World’s 50 Biggest Banks 2010
Rank Bank Country Total Assets ($m) Statement Date
1 BNP Paribas France 2,669,906 12/31/10
2 Deutsche Bank Germany 2,546,272 12/31/10
3 HSBC Holdings United Kingdom 2,454,689 12/31/10
4 Barclays United Kingdom 2,331,943 12/31/10
5 The Royal Bank of Scotland Group United Kingdom 2,275,479 12/31/10
6 Bank of America United States 2,268,347 12/31/10
7 Crédit Agricole France 2,129,248 12/31/10
8 JPMorgan Chase United States 2,117,605 12/31/10
9 Industrial & Commercial Bank of China (ICBC) China 2,032,131 12/31/10
10 Citigroup United States 1,913,902 12/31/10
11 Mizuho Financial Group Japan 1,890,220 03/31/11
12 Bank of Tokyo-Mitsubishi UFJ Japan 1,687,313 03/31/10
13 ING Group Netherlands 1,666,368 12/31/10
14 China Construction Bank China 1,632,261 12/31/10
15 Banco Santander Spain 1,626,805 12/31/10
16 Bank of China China 1,579,346 12/31/10
17 Agricultural Bank of China* China 1,568,722 12/31/10
18 Lloyds Banking Group United Kingdom 1,552,245 12/31/10
19 Société Générale France 1,512,657 12/31/10
20 UBS Switzerland 1,401,924 12/31/10
21 Groupe BPCE France 1,400,911 12/31/10
22 Wells Fargo United States 1,258,128 12/31/10
23 Sumitomo Mitsui Banking Corporation Japan 1,247,053 03/31/10
24 UniCredit Italy 1,241,967 12/31/10
25 Credit Suisse Group Switzerland 1,098,345 12/31/10
26 Commerzbank Germany 1,007,882 12/31/10
27 Goldman Sachs Group United States 911,332 12/31/10
28 Intesa Sanpaolo Italy 880,221 12/31/10
29 Rabobank Group Netherlands 871,908 12/31/10
30 Norinchukin Bank** Japan 844,431 09/30/10
31 China Development Bank China 771,729 12/31/10
32 Nordea Bank Sweden 776,108 12/31/10
33 Dexia Belgium 757,262 12/31/10
34 Banco Bilbao Vizcaya Argentaria (BBVA) Spain 738,560 12/31/10
35 Royal Bank of Canada (RBC)* Canada 713,646 12/31/10
36 National Australia Bank* Australia 664,174 12/31/10
37 Commonwealth Bank of Australia Australia 660,205 12/31/10
38 Toronto-Dominion Bank (TD) Canada 608,113 12/31/10
39 Westpac Banking Corporation* Australia 598,647 12/31/10
40 Bank of Communications China 596,655 12/31/10
41 KfW Germany 590,269 12/31/10
42 Danske Bank Denmark 572,547 12/31/10
43 Scotiabank (Bank of Nova Scotia) Canada 516,939 12/31/10
44 Standard Chartered United Kingdom 516,542 12/31/10
45 Australia & New Zealand Banking Group (ANZ) Australia 514,857 09/30/10
46 DZ Bank Germany 512,378 12/31/10
47 ABN Amro* Netherlands 509,249 12/31/10
48 Banque Fédérative du Crédit Mutuel (BFCM) France 501,422 12/31/10
49 Landesbank Baden-Württemberg (LBBW) Germany 500,285 12/31/10
50 Banco do Brasil Brazil 481,179 12/31/10

Source: Fitch Ratings except

* Moody’s Investors Service

** Norinchukin Bank

Source: Global Finance

Three of the four U.S. super-banks are in the top ten. With the exception of ICBC, the rest of the top 10 are either European or American banks. None of the banks from Russia and India made it to this list.

Disclosure: Long many banks in the above list

Knowledge is Power: Argentina, Sweden, Housing Madness Edition

What Options Are Left for the Common Currency?

Signs of Desperation: Fee Increases Signal End of an Era for Too Big To Fail Banks

How Argentina left its Eurozone

Should you run from the bear or grin at it?

Mishra: India’s Rising Tide Doesn’t Lift All Rural Boats

Lessons learned from the dotcom bubble

That’s how it worked out for Sweden

American jobless: unemployed and uncounted

How long can the housing madness last?

Bullet Train, Japan


Keep Calm and Buy These 10 Foreign Stocks

The extreme volatility in the equity markets in the past few weeks are making many investors nervous. Some of them are making the wrong moves based on emotions. Yesterday’s Wall Street Journal had an article discussing how some people are liquidating their equity holdings and moving into cash. From the article titled “Tired of Ups and Downs, Investors Say, ‘Let Me Out!‘”:

Leonard Gerber, a 65-year-old financial planner, has seen plenty of volatile markets during his career. But this one feels different.

Last month, the Syracuse, N.Y., resident cashed in his stock funds—and he has no intention of diving back in anytime soon. “I feel like a deer in headlights,” he says.

Across the country, investors are fleeing the stock market for the safety of cash. On Tuesday the Standard & Poor’s 500-stock index lost as much as 2.2% before a late-day rally sent the index up 2.3% for the session. In the 46 trading days since the beginning of August, the S&P 500 has seen 29 swings of 1% or more.

Tuesday is a “perfect example” of why Mr. Gerber has bailed out. “The market is manic,” he says. “There’s no consistency … and there’s a worrisome amount of volatility.”

The wild action is keeping brokerage firms busy. At Scottrade Inc., trading volume increased 36% on Tuesday afternoon from the day before, which was 30% higher than last week’s average. Principal Financial Group saw call-center volume from investors in work-based retirement plans climb 27% between Friday and Monday.

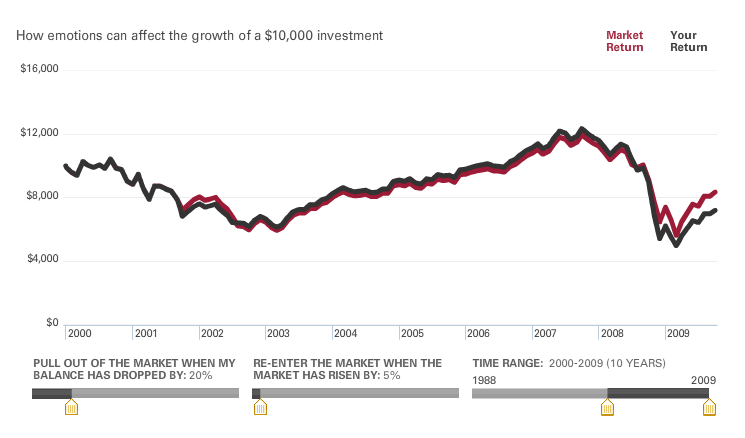
Making investment decisions based on emotions rarely helps investors. As markets are unpredictable, one cannot move in and out of the market without losing gains. This is especially true for retail investors who do not have the time and resources required to analyze market activity on a daily basis.

The following graphs show how returns are negatively impacted with emotional investing:

Scenario #1: Getting out of the market when the account balance has dropped by 20% and re-entering the market when the market has risen by 5%:


Scenario #2: Getting out of the market when the account balance has dropped by 20% and re-entering the market when the market has risen by 15%:

Click to enlarge


Note: The illustration above is a hypothetical example based on total daily returns for the Standard & Poor’s 500 Index for the period noted. It does not account for any investment costs such as commissions, or bid/ask spreads.

Source: The truth about emotion,  The Vanguard Group

Last month many foreign markets entered bear market territory with stocks falling 20% or more. This has created excellent opportunities for long-term investors. Some of the high-quality European stocks are particularly attractive at current levels. Ten such foreign stocks paying dividends of more than 3% are listed below for investors to consider:

1.Company: Empresa Nacional de Electricidad SA (EOC)
Current Dividend Yield: 7.88%
Sector:Electric Utilities
Country: Chile

2.Company: Nestle (NSRGY)
Current Dividend Yield: 3.85%
Sector:Beverages (Nonalcoholic)
Country: Switzerland

3.Company: Tesco plc (TSCDY)
Current Dividend Yield: 4.02%
Sector:Retail (Grocery)
Country: UK

4.Company: Akzo Nobel NV (AKZOY)
Current Dividend Yield: 4.62%
Sector:Chemical Manufacturing
Country: The Netherlands

5.Company: Novartis (NVS)
Current Dividend Yield: 4.26%
Sector:Major Drugs
Country: Switzerland

6.Company: Eni SpA (E)
Current Dividend Yield: 8.30%
Sector:Oil & Gas – Integrated
Country: Italy

7.Company:ABB Ltd (ABB)
Current Dividend Yield: 4.09%
Sector:Electronic Instrumentation & Controls
Country: Switzerland

8.Company:Alumina Ltd (AWC)
Current Dividend Yield: 4.94%
Sector:Metal Mining
Country: Australia

9.Company:TransCanada Corp (TRP)
Current Dividend Yield: 4.16%
Sector:Natural Gas Utilities
Country: Canada

10.Company:Aviva PLC (AV)
Current Dividend Yield: 9.61%
Sector:Insurance (Life)
Country: UK

Disclosure: Long ABB

The Next U.S. Crisis Could be Worse Than the Previous One

The U.S. markets made a dramatic turnaround today with the S&P 500 soaring 4.1% in the final 50 minutes of trading. Up until few weeks ago US stocks had held up well compared to European stocks as investors assumed the European debt crisis would have a smaller impact here. However despite the perceived strength of the US economy many fundamental problems still remain.

I came across a research paper titled “Lessons We Should Have Learned from the Global Financial Crisis but Didn’t” by Randall Wray of Levy Economics Institute of Bard College, NY. From the paper:

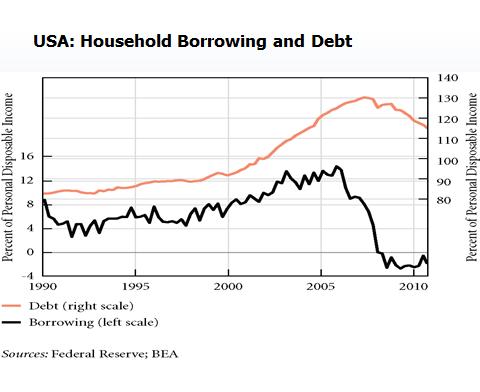
Almost all the debt that we had in 2007 still exists. Households have repaid some, and they have defaulted on some, but most of it still exists, as shown in the next figure. Meanwhile, households have lost their jobs, and a lot of them have lost their houses—which doesn’t mean they have lost the debt because in a lot of cases they still owe the money but they don’t have the house. House prices have declined by about a third across the country, and they are still declining. So there is no way that households and firms are better off now than they were in 2007. In most ways they are much worse. A have of defaults on commercial real estate could be the next thing to hit. Or, student loans or credit card debt could trigger the next crisis as the value of those assets gets downgraded. That is one path back into crisis.

The author also notes that another trigger for a crisis could be that banking regulators might discover one or more big banks to be massively insolvent. He suggests Citigroup(C) and Bank of America(BAC) could be the banks where such problems begin as both of them are still saddled with huge debts that have not been written off.

Mr.Randall makes an excellent point. Though banks and other firms are allowed to write off bad debts, individuals do not get the same privilege. As a result, people are on the hook for any debt owed to banks and banks hold the authority to to recover the amount or forgive based on individual circumstances. The following story in The Wall Street Journal shows the lengths to which some banks will go to recover every cent owed even if it is a home loan which are usually non-recourse in the U.S.

From House Is Gone but Debt Lives On in the WSJ:

LEHIGH ACRES, Fla.—Joseph Reilly lost his vacation home here last year when he was out of work and stopped paying his mortgage. The bank took the house and sold it. Mr. Reilly thought that was the end of it.

In June, he learned otherwise. A phone call informed him of a court judgment against him for $192,576.71.

It turned out that at a foreclosure sale, his former house fetched less than a quarter of what Mr. Reilly owed on it. His bank sued him for the rest.

The result was a foreclosure hangover that homeowners rarely anticipate but increasingly face: a “deficiency judgment.”

Forty-one states and the District of Columbia permit lenders to sue borrowers for mortgage debt still left after a foreclosure sale. The economics of today’s battered housing market mean that lenders are doing so more and more.

With the unemployment rate remaining high and millions of homeowners underwater on their mortgages and the real estate market showing a lack of any recovery the chances for another crisis is indeed high.

Disclosure: No positions

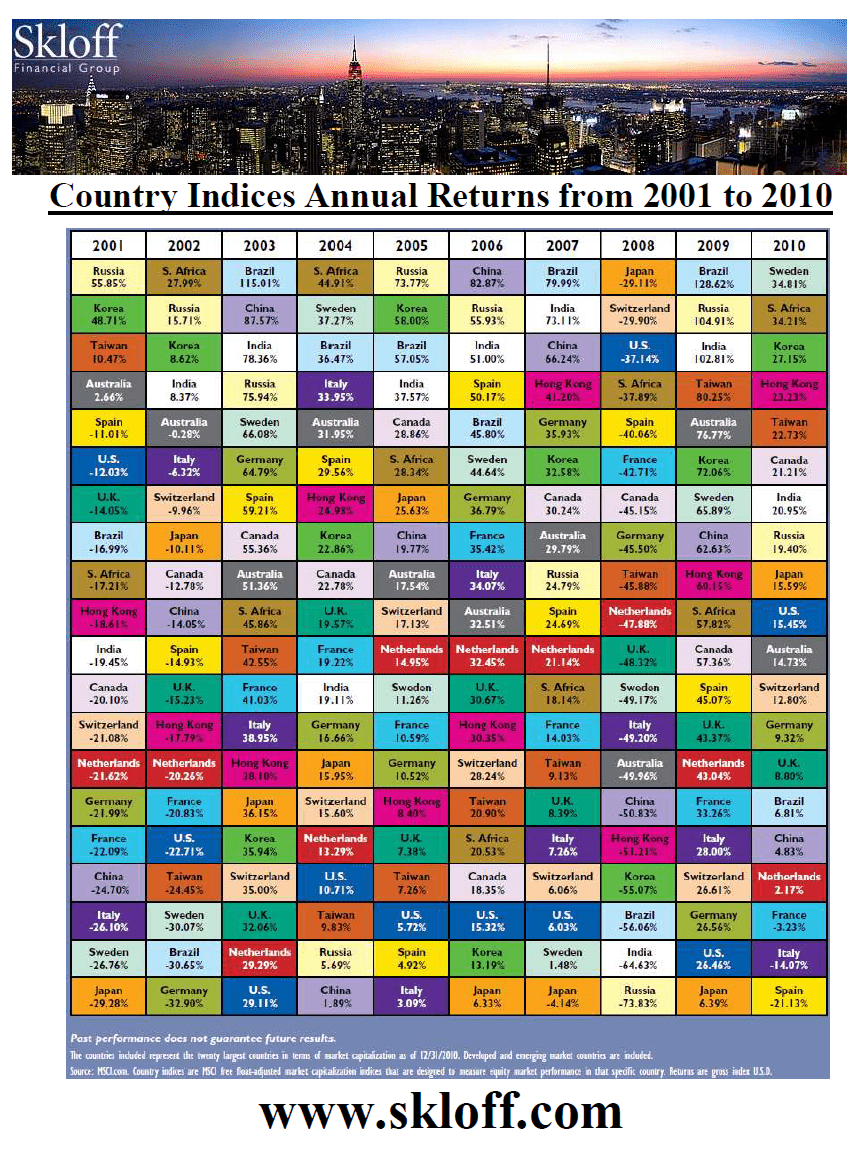
Country Indices Annual Returns from 2001 to 2010

The periodic table of investment returns for country indices annual returns from 2001 to 2010 are shown in the chart below:

Click to enlarge


Source: Skloff Financial Group

Some observations:

  • In the Global Financial Crisis (GFC) of 2008, the BRIC countries were some of the hardest hit countries with the Russian market loosing nearly 74%. However in 2009, Brazil, India and Russia were the three best performing markets.
  • Though the crisis originated in the U.S. European and Canadian markets went down more than US markets in 2008.
  • For many years during the period shown, Brazilian stocks performed very well earning double-digit returns for investors. Similarly commodity-rich Australia has been a consistent performer in most of the years.
  • While the U.S. market held up well in 2008, the performance of the US markets was average in the majority of years.

Related ETFs:
SPDR S&P 500 ETF (SPY)
iShares S&P India Nifty 50 (INDY)
iShares MSCI Brazil Index (EWZ)
iShares MSCI Germany Index Fund (EWG)
iShares MSCI Canada Index Fund (EWC)
iShares MSCI Australia Index Fund (EWA)

Disclosure: No Positions