Avoid Companies Buying Their Own Stocks

Stock buybacks by U.S. companies has reached record levels. Flush with billions in cash many companies have figured out that the best way to spend those funds is to simply buy their own shares.

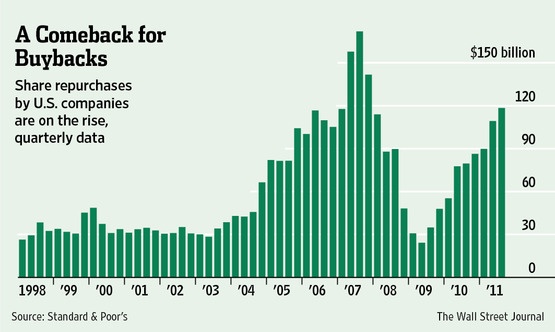
The following chart from a recent Wall Street Journal article shows the gradual rise in share buybacks since the market lows of 2009:

Click to enlarge
From the article:

Among companies in the Standard & Poor’s 500-stock index, repurchase spending totaled at least $437 billion last year, a 46% increase from 2010, estimates Howard Silverblatt, senior index analyst at S&P.

Share buybacks rarely benefit shareholders. Instead of paying dividends or making capital investments, companies take the easy way and implement share buybacks.Unlike other countries, the phenomenon of companies buying and sometimes trading in their own shares is very high in the U.S. Short-term mentality of managements, stock options and other factors drive companies to boost stocks price at all costs including spending excess cash on the balance sheet on share buybacks.

The reason usually given by managements for share buybacks is that the stock is undervalued. But in reality it just shows that managements are unable to find better uses for the cash. Just like any other investor, companies also cannot accurately determine if their stock is undervalued and also they cannot predict the future direction of the stock. Despite the odds of being right so negligible, companies buy their own shares anyway hurting shareholders. So generally it is a wise idea to avoid companies that implement share buybacks.

A recent article by CNBC confirms the theory that most share buybacks don’t benefit shareholders. From the article titled “Most Share Buybacks Don’t Pay Off for Investors“:

With cash at record levels, stock buybacks are an increasingly popular way to use free cash flow.

Investors often equate buybacks with management’s belief that the company is undervalued by the market, and purchases can significantly affect the performance of a company stock if the timing is right. But Thomson Reuters’ data shows that’s not always the case.

According to the report, out of 380 companies in the S&P 500 that repurchased shares in at least five of the quarters, 84 companies bought shares when the stock price was high, and only 60 firms were able to buy low.

In addition, 72 companies saw poor returns within a year following share repurchases, versus 57 that saw good results.

The findings point to a combination of bad market timing as well as policies that increase buybacks when companies have more free cash flow.

“This may be partially explained by the need for officers of public companies to make some use of the cash on hand, including keeping less of it due to the possibility of being taken over,” says the report.

Very few companies that have implemented share buybacks have seen their share prices rise consistently and benefit investors. International Business Machines Corp. (IBM) is one company that I can think whose share buybacks has benefited investors. Last October a Bloomberg article noted that IBM plans to spend $50 billion on buybacks through 2015.

Disclosure: No Positions
Comparing Sources of Electricity Generation in North American OECD Countries

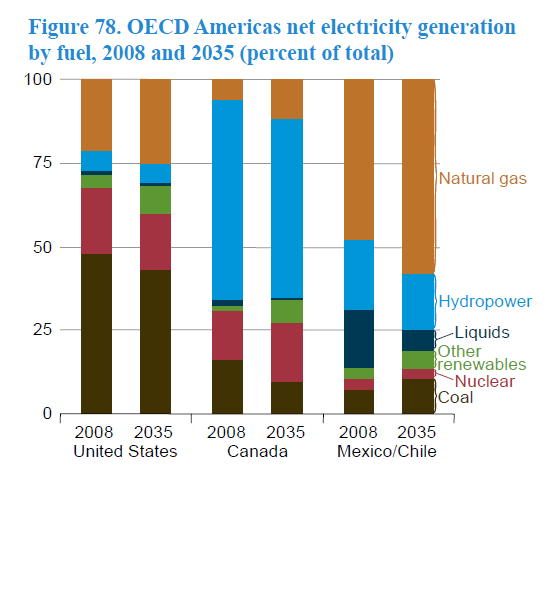
I came across the following interesting chart showing the sources of power generation in the OECD countries of North America:

Source: International Energy Outlook 2011, U.S. Energy Information Administration

Coal is the major source of electricity generation in the U.S.. Accounting for about 50% of the fuel source in 2008, it is projected to decline by 2035 but still accounting for about 40% of the fuel used for power generation. This percentage is much higher than in Canada, Mexico and Chile. Canada produces much of the electricity from hydro power and Mexico and Chile use natural gas as the main fuel source.

Related ETFs:

Market Vectors-Coal ETF (KOL)
Utilities Select Sector SPDR Fund (XLU)

Disclosure: No Positions

What Are The Global Risks in 2012?

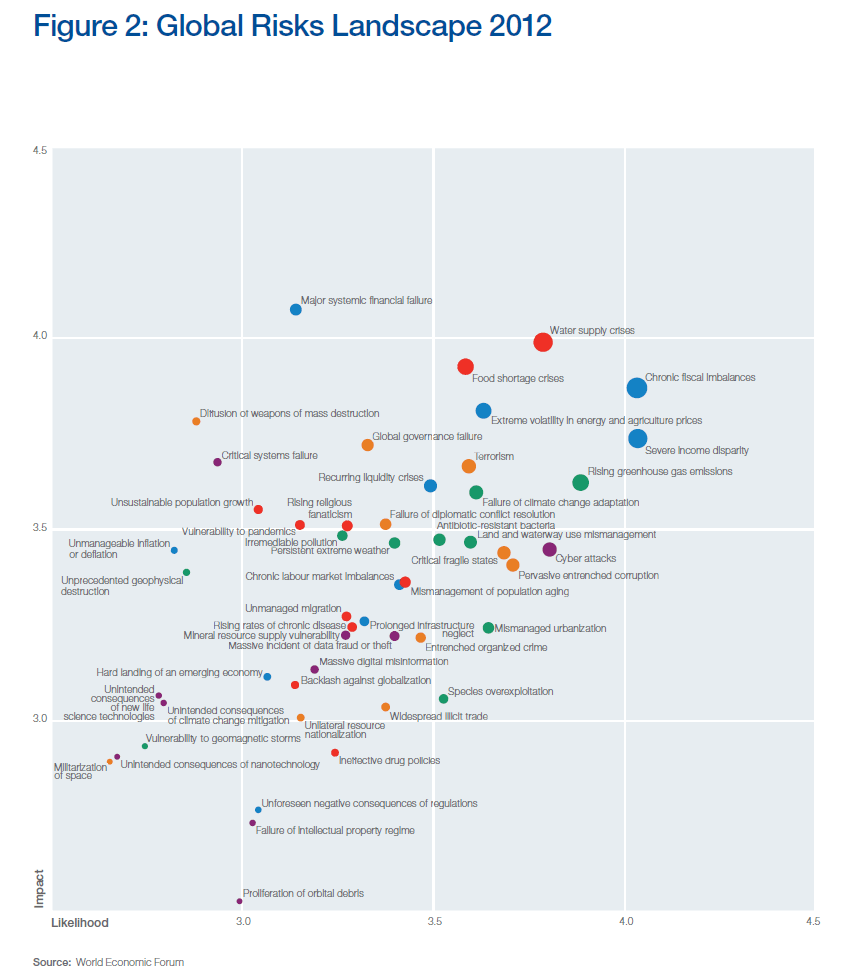
The World Economic Forum has published the Global Risks 2012 report. One of the key takeaways from the report is the graphic below that shows the top global risks this year with their likelihood of occurring and impacts:

Click to enlarge

It is interesting to note that the risk of “Chronic fiscal imbalances” is ranked high but “Hard landing of an emerging economy” is ranked low.

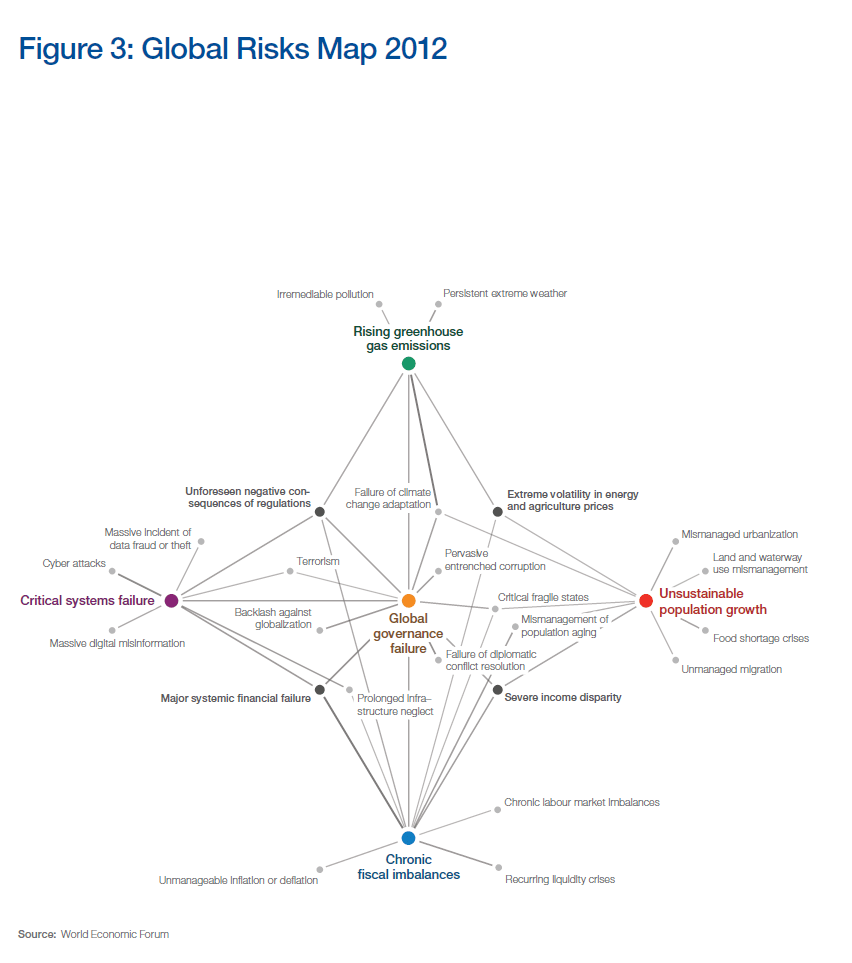
The graphic below shows the interconnection between the risks:

Source: Global Risks 2012 – Seventh Edition, World Economic Forum

PFC Energy: The World’s Top 50 Energy Companies 2012

The global energy consultancy PFC Energy has published its annual ranking of the World’s Top 50 Energy Companies for 2012 based on market capitalization.

The table below lists the PFC Energy 50 with their US market tickers if available:

[TABLE=1055]

Source: Bloomberg, PFC Energy estimates as of 12/31/2011

• Share price growth based on primary exchange tickers in $US.
• Prices for thinly traded companies are as of year’s last trade.
• Changes in market capitalization may differ from changes in share price due to mergers, share repurchases and other factors.

* BHP Billiton is ranked based on 20% of the market capitalization of the parent company, representing the contribution of the petroleum segment to corporate EBIT in the 12 months ended 6/30/11.

** Midstream/Infrastructure category added this year.

Note:

NOC – National Oil Companies
NOC – International Oil Companies
E&P – Exploration & Production
R&M – Refining & Marketing

Oil supermajor ExxonMobil (XOM) maintained the top rank with a market cap of $406.3 billion followed by PetroChina. National Oil Companies and companies located in the emerging markets underperformed in this ranking as investors viewed “these companies more critically due to country risk exposure and lack of portfolio diversification”. In recognition of the expanding oil and gas potential of North American onshore this year’s list includes four midstream and pipeline companies – Enterprise (#25), TransCanada (#37), Enbridge (#40) and Kinder Morgan (#41).

Source: PFC Energy

Disclosure: Long EONGY, PBR

Looking for Opportunities Among Europe’s Largest Electricity Companies

Most European equity markets were down by digits last year due to the debt crisis. Along with stocks from other sectors investors also dumped the traditionally stable utility stocks. The STOXX® Europe 600 Utilities Index reached a high of over 600 before the global financial crisis (GFC) of 2008 in US dollar terms. On 1/20/12 it closed at well below 300 for a loss over 50% from the peak.

European markets are performing well so far this year and many utilities in particular look cheap at current levels. Fears over nuclear power generation in Germany has for the most part subsided and large European utilities are looking for growth both in the European market and emerging markets. For example, earlier this month German electric utility E.ON announced a strategic partnership with Brazilian company MPX to invest in the Brazilian and Chilean energy markets. E.ON plans to ultimately invest € 350 million for a 10% stake in MPX.

The chart below shows the Top 15 Electricity Producers in Europe in 2009:

Source: Vattenfall Annual Report 2010

The largest players in the European energy market in terms of sales are EDF (France), Enel (Italy),
E.ON (Germany), GDF Suez (France), and RWE (Germany). These firms have operations across Europe and some of them also have significant presence outside of Europe. In addition to these larger firms, there are a number of regional companies including Centrica and SSE (UK), CEZ (Czech Republic), Dong (Denmark), EDP (Portugal), Fortum (Finland), Gas Natural Fenosa and Iberdrola (Spain), Statkraft (Norway), Vattenfall (Sweden) and Verbund (Austria). There are also a large number of local electricity suppliers mostly municipality-owned. In Sweden there are some 120 such firms, in Germany about 900 and in The Netherlands some 80.

The Top European Electricity Producers are listed below together with their ADR tickers, if available and the current dividend yields for consideration:

1.Company: Electricite de France (ECIFY)
Current Dividend Yield: 7.00%
Country: France

2.Company: E.ON AG (EONGY)
Current Dividend Yield: 10.22%
Country: Germany

3.Company: RWE AG (RWEOY)
Current Dividend Yield: 14.50%
Country: Germany

4.Company: GDF Suez (GDFZY)
Current Dividend Yield: 7.46%
Country: France

5.Company: Enel (ENLAY)
Current Dividend Yield: 13.11%
Country: Italy

6.Company: Vattenfall
Current Dividend Yield: N/A
Country: Sweden

7.Company: Iberdrola (IBDRY)
Current Dividend Yield: 1.39%
Country: Spain

8.Company: EnBW
Current Dividend Yield: N/A
Country: Germany

9.Company: CEZ (CZAVF)
Current Dividend Yield: N/A
Country: Czech Republic

10.Company: PGE (PGPKY)
Current Dividend Yield: N/A
Country: Poland

11.Company: Statkraft
Current Dividend Yield: N/A
Country: Norway

12.Company: PPC
Current Dividend Yield: N/A
Country: Greece

13.Company: Fortum (FOJCY)
Current Dividend Yield: 6.92%
Country: Finland

14.Company: SSE (SSEZY)
Current Dividend Yield: 5.94%
Country: UK

15.Company: Edison Spa
Current Dividend Yield: N/A
Country: Spain

Note: Dividend yields noted above are as of Jan 20, 2012

It must be noted that the respective state is the majority owner in many European utilities such as EDF (France),  GDF Suez (France), Enel (Italy) and Fortum (Finland). Sweden’s Vattenfall is unlisted since it is 100% owned by the state.

Disclosure: Long EONGY, RWEOY