Why Unemployment Rate Varies Widely Among Developed Countries

During the great recession between 2006 and 2009 the unemployment rate in advanced countries increased more than in emerging countries. However the change in unemployment between developed countries rates has varied significantly. Some countries  such as Australia and Japan fared better while countries like Spain, Ireland, etc. experienced a strong growth in the unemployment rates.

In the U.S. the official unemployment rate as of July stood at 8.3% with some 12.8 million persons out of work. The latest unemployment rates in select advanced economies are shown below:

US = 8.3%
Germany = 6.8%
Canada = 7.3%
Australia = 5.2%
UK = 8.1%
Japan = 4.3%
France = 10.0%
Spain = 24.6%

According to the IMF, the unemployment rate in advanced countries is projected to fall by less than 0.5% by 2014 due to the week economic recovery.

According to the article “Tracking the Global Recovery” by Ayhan Jose, Prakash Loungani and Marco E.Torrones  in the latest version of IMF’s Finance and Development magazine,

Three factors account for this variation: the extent of growth (or lack thereof) in incomes, structural bottlenecks, and the impact of macroeconomic and labor market policies.Structural factors may have played a supporting role in some countries, particularly where the collapse of the housing sector was a major reason for the drop in output. And the role of policies, particularly labor market policies such as worksharing,could be important in some specific cases, such as in explaining why Germany had a decline in unemployment.

In Germany, employers receive subsidies to encourage them to retain workers but reduce their working hours and wages.

Among the three factors, the authors note that the growth factor is the most important.

The following chart shows the change in the unemployment rate for select advanced economies between 2007 and 2011:

Click to enlarge
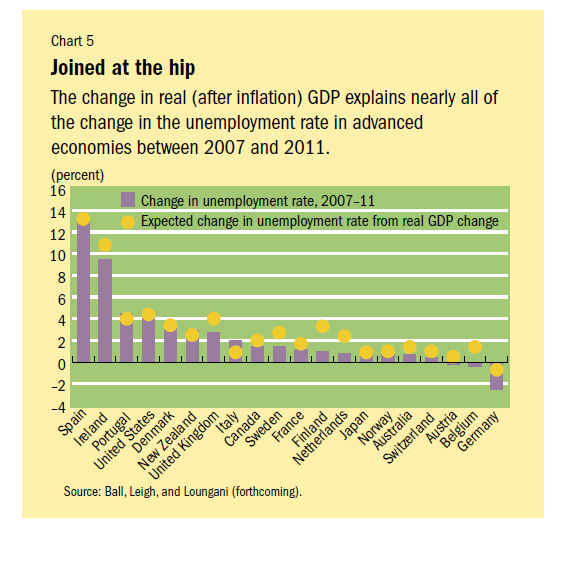
Source: Finance and Development, June 2012, IMF

Spain, Ireland, Portugal and the U.S. experienced the largest increase in unemployment rates for the period between 2007 and 2011. However  in Australia, Switzerland, Austria, Belgium, and Germany, the unemployment rate barely rose or even decreased over those years. The reason for the difference in unemployment rates between these two sets of countries can be attributed to Okun’s law which explains the relationship between increases in unemployment and decreases in a country’s GDP. It states that for every 1% in unemployment rate, a country’s GDP will decrease by about 2% from its potential GDP.
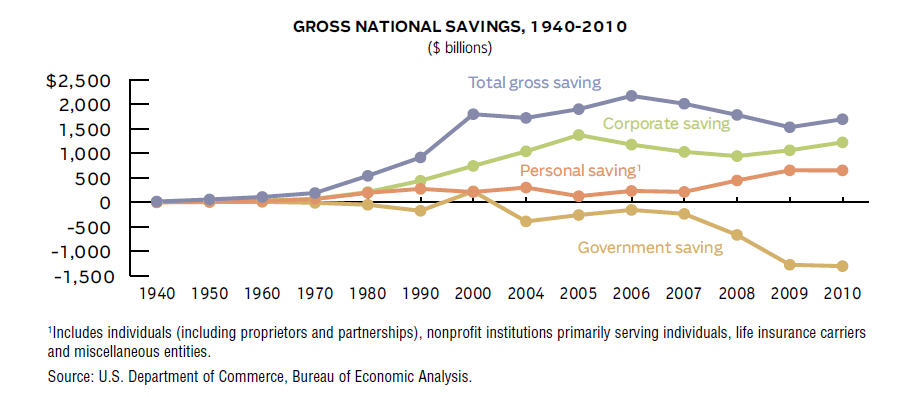
U.S. Corporate, Government and Personal Savings from 1940 to 2010

U.S. companies save more than governments and individuals. This is especially true in the past few years as companies started hoarding cash instead of reinvesting them or distributing them to investors. According to one estimate, U.S. corporation held more than $1.7 Trillion in cash and equivalents at the end of March this year.

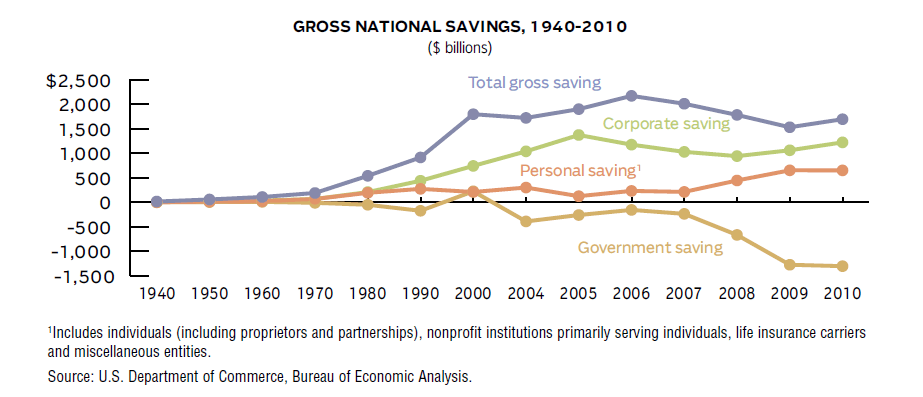
The chart below shows the gross national savings between corporations, individuals and government from 1940 to 2010:

Click to enlarge

Source: 2012 Financial Services Fact Book 2012 by Insurance Information Institute and Financial Services Roundtable.

Gross national savings grew dramatically in late 1990s and early 2000s peaking in 2006. Since 2000, government saving has been negative as state and federal government spending rose more than revenues.This situation became especially worse since the credit crisis. For example in 2009 and 2010, all levels of government spent $1.3 Trillion more than they collected in revenues.

On the other hand, gross corporate savings has increased in both 2009 and 2010. Personal savings rose from $447.9 billion in 2008 to $655.3 billion in 2009, the highest level on record and remained virtually unchanged in 2010. Overall since the mid 80s corporations have saved more than individuals each year. One important factor for the huge difference in personnel and corporate savings is globalization which reduced the salary levels of workers while companies benefited tremendously not only from cheap labor but also from explosive growth in overseas markets. As corporations are continuously finding more ways to cut costs while simultaneously raising prices or increasing sales, they will save more than governments and individuals.

Stock Trading Volume in NYSE and NASDAQ From 2001 To 2010

Trading volumes in both the New York Stock Exchange (NYSE) and NASDAQ (NAS) have increased since the start of the 21st century.Some of the the reasons for the rise in trading volumes include high volatility in the markets, investor anxiety, high-frequency trading (HFT), short-term trading by hedge funds, etc.While dramatic fall in share prices in the past few years  have to be taken into account when analyzing trading volumes, that is not a major factor for the rise in trading.

In 2001, there were 4,109 companies listed on the NASDAQ. By the end of the decade the figure decreased to just 2,784. On the NYSE, the number jumped from 2,798 to 3,923 during the same period. But this jump was mostly due to the takeover of Amex by NYSE which added about 600+ companies in 2009.

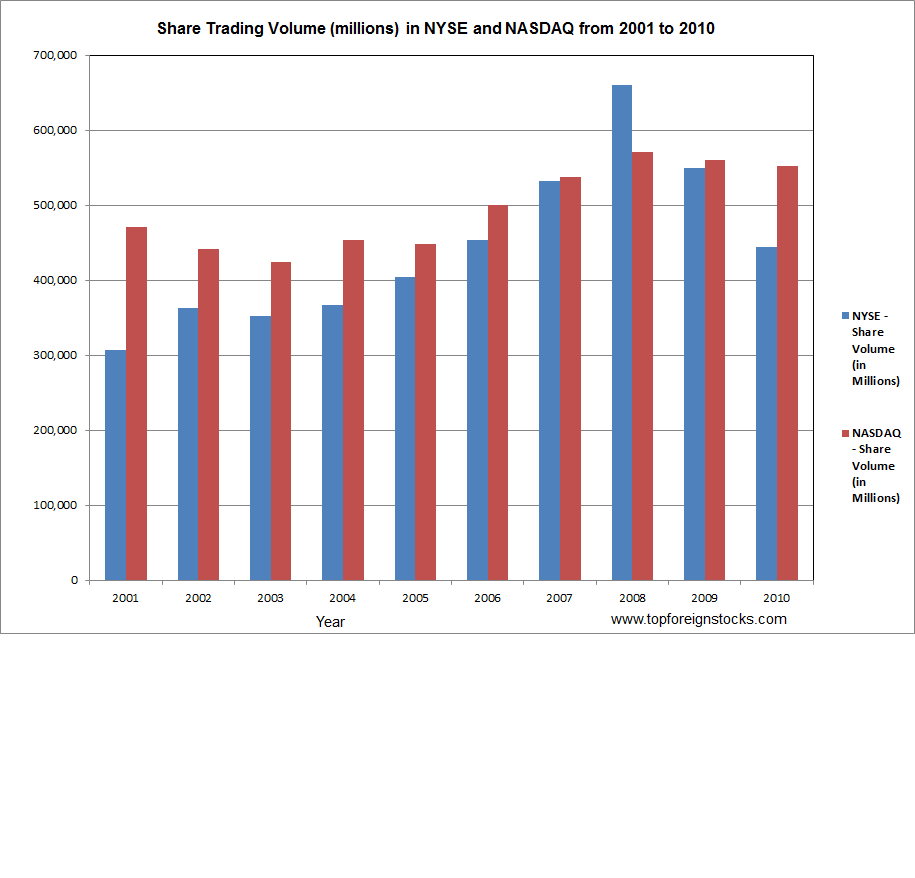
In 2001, about 307 billion shares were traded on the NYSE. By 2010 this number jumped to 444 billion (or) an increase of about 45%. Over at the NASDAQ, the total share trading volume was about 471 billion in 2001. This figure jumped to 552 billion in 2010 representing an increase of about 17%. In terms of the value of shares traded, the dollar amount increased from $10.4 Trillion in 2001 to $11.9 Trillion in 2010 at the NYSE. Currently the average daily volume on the NYSE and the NASDAQ are over 3.0 and 1.8 billion respectively.

The following graph shows the change in trading volume at NYSE vs. NASDAQ from 2001 to 2010:

Click to enlarge

Data Source:

New York Stock Exchange, Inc; American Stock Exchange LLC; The NASDAQ Stock Market, Inc; Securities Industry and Financial Markets Association;
via 2012 Financial Services Fact Book 2012 by Insurance Information Institute and Financial Services Roundtable.

While trading volumes have soared, the duration of stock holding stocks periods in the US has declined sharply in the past few decades.This situation does not bode well for the long-term strength of the US equity markets.

Related ETFs:

SPDR S&P 500 ETF (SPY)

PowerShares QQQ (QQQ)

Disclosure: No Positions

Update:

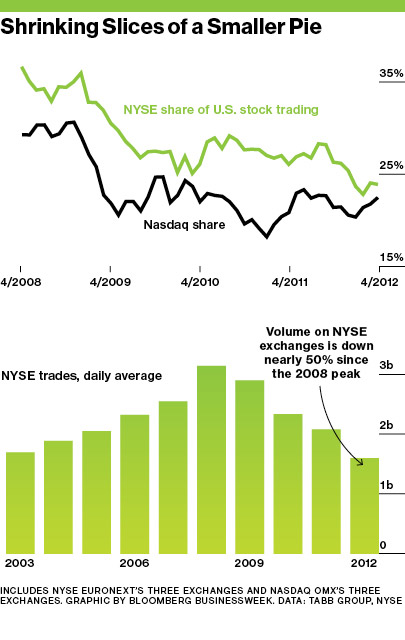
Source: Where Has All the Stock Trading Gone?, Bloomberg BusinessWeek

Why Invest in U.S. Coal Companies?

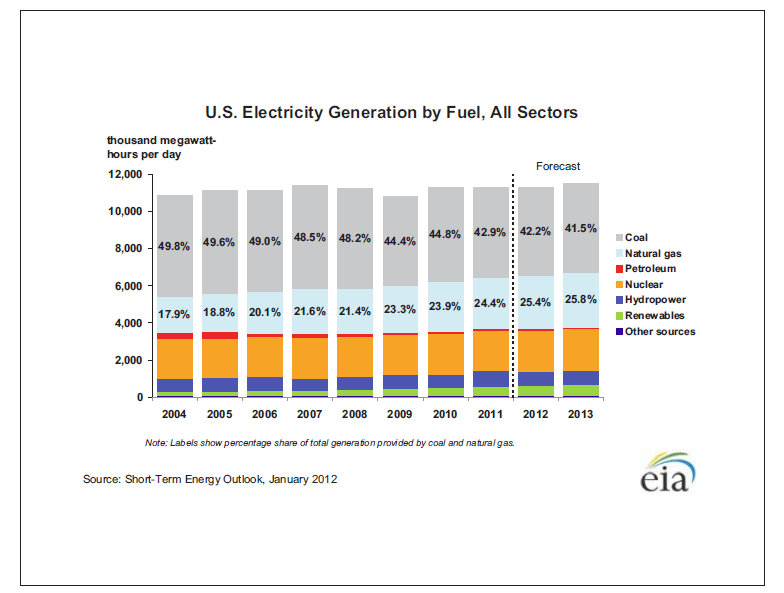
Coal remains the major source of power generation in the U.S. Just over 42% of total power generated comes from coal-powered plants.With the rise of renewal energy and the use of natural gas for power production, the demand for coal is projected to decline slightly next year.However coal will continue to be the main fuel for electricity generation for many years to come.

Outside of the U.S., some countries rely heavily on sources other than coal for their electricity needs.One reason these countries avoid coal is that burning of coal pollutes the environment. Despite the pollution issue, power producers in the U.S. prefer coal since it is very cheap and is readily available in huge quantities.Unlike China or India, the U.S. does not need to import coal from other countries.In an innovative marketing move, the coal industry has even started calling the regular, black and dirty stuff as “Clean Coal” to imply that coal is somehow “clean”.

Brazil produces produces most of its electricity from renewable sources.According to a report, an astonishing 88.8% of power produced there in 2011 came from renewable sources. Brazil is also a net exporter of  electricity to neighboring countries. Among the developed countries France produces 78% of its electricity from nuclear energy. Coal contributes just 3.9% of the total French power production compared to over 42% in the U.S. Our neighbor Canada generates 60% of power from hydro power.

The chart belows shows the U.S. electricity generation by fuel type:

Click to enlarge

Source: Short-Term Energy Outlook. U.S. EIA, January 2012

Since 2004 the use of coal for power production has declined by about 8%.

Some of the top U.S. coal companies that investors can consider are Arch Coal(ACI), Alpha Natural Resources (ANR) and Peabody Energy Corporation (BTU).

Another easy way to invest in coal is via the Market Vectors Coal ETF (KOL). Currently the fund has an asset base of about $174 Million.

Disclosure: No Positions

U.S. Defense Spending Relative to GDP, Population

The current population of U.S. is about 314 million or about 5% of the world’s total population. The 15.0$ Trillion U.S. economy is the largest in the world and accounts for nearly one-fourth of the world’s total GDP.

Though the U.S. is separated from the rest of the world by oceans on two sides, an peaceful ally in the North and a failed state in the South, the country spends the most on military than any other country in the world including the other military superpower Russia. In 2010, the U.S. defense expenditures totaled $698 billion representing an 81% increase over the previous decade. Despite rising social and economic problems domestically, as the world’s policeman the U.S. is forced to allocate a large chunk of precious resources for the military.

Though having only 5% of the world’s population, the U.S. spent about 42% of the global military spending as shown in the following chart:

Click to enlarge


Source: CFR

From the 1999 article “A Manifesto for the Fast World” in the New York Times by Thomas L. Friedman:

“The hidden hand of the market will never work without a hidden fist. McDonald’s cannot flourish without McDonnell Douglas, the designer of the F-15. And the hidden fist that keeps the world safe for Silicon Valley’s technologies to flourish is called the US Army, Air Force, Navy and Marine Corps.”