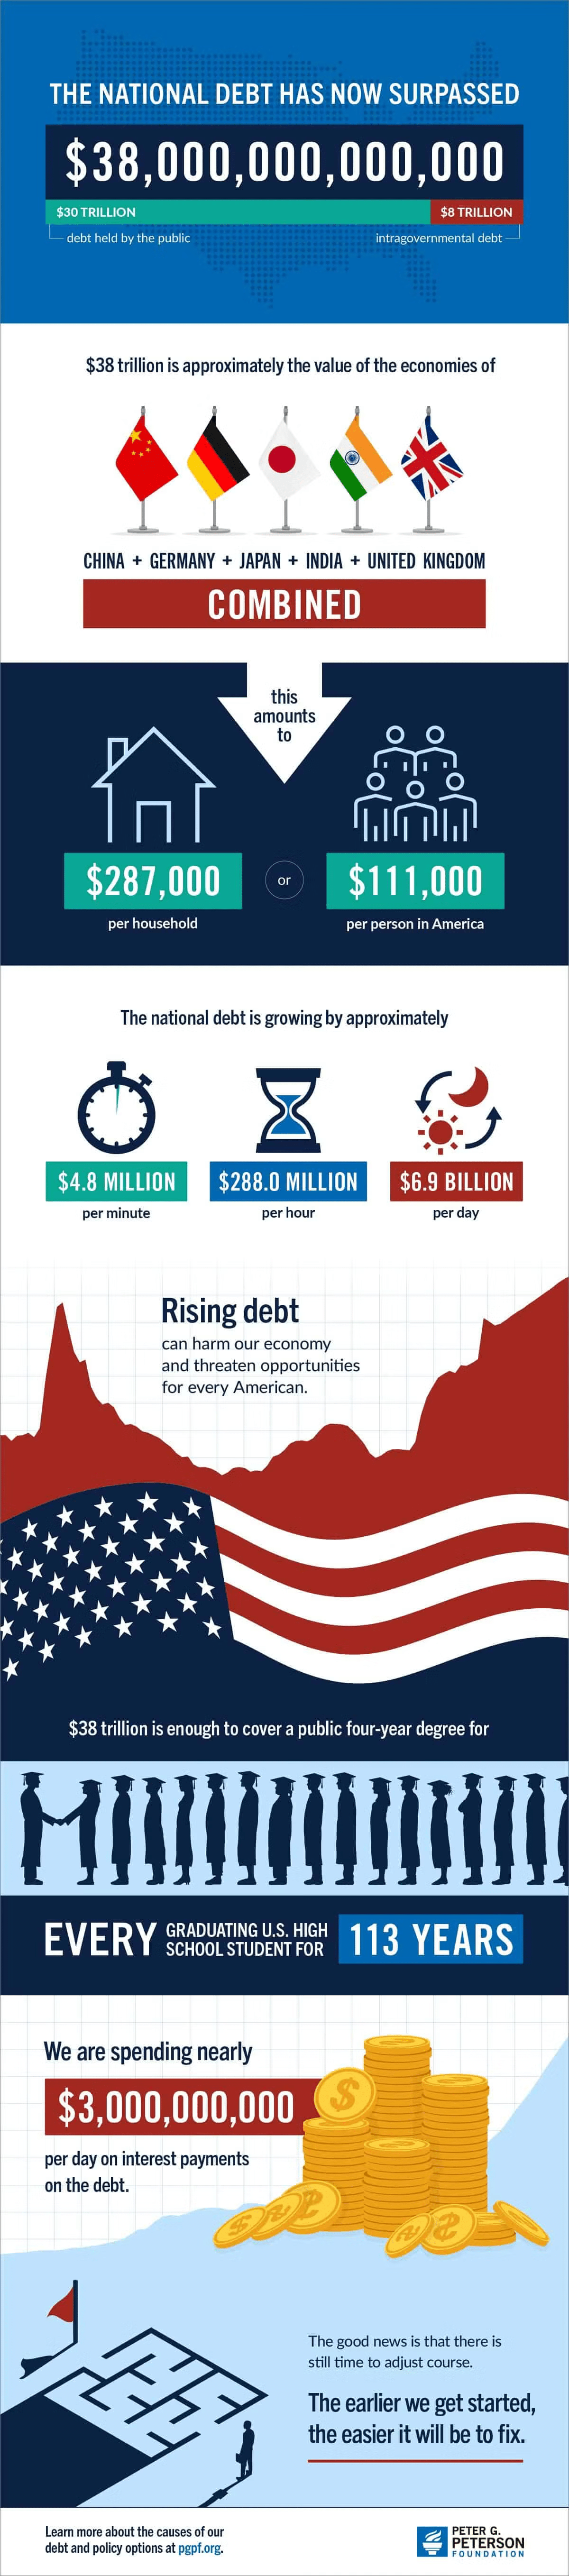
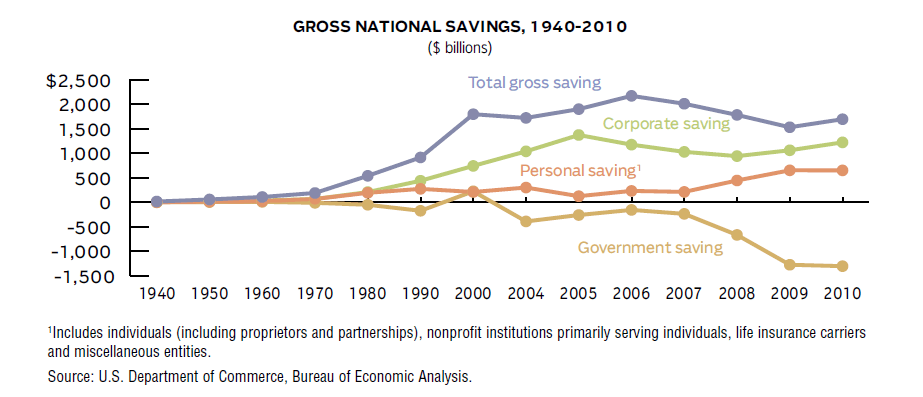
U.S. companies save more than governments and individuals. This is especially true in the past few years as companies started hoarding cash instead of reinvesting them or distributing them to investors. According to one estimate, U.S. corporation held more than $1.7 Trillion in cash and equivalents at the end of March this year.
The chart below shows the gross national savings between corporations, individuals and government from 1940 to 2010:

Source: 2012 Financial Services Fact Book 2012 by Insurance Information Institute and Financial Services Roundtable.
Gross national savings grew dramatically in late 1990s and early 2000s peaking in 2006. Since 2000, government saving has been negative as state and federal government spending rose more than revenues.This situation became especially worse since the credit crisis. For example in 2009 and 2010, all levels of government spent $1.3 Trillion more than they collected in revenues.
On the other hand, gross corporate savings has increased in both 2009 and 2010. Personal savings rose from $447.9 billion in 2008 to $655.3 billion in 2009, the highest level on record and remained virtually unchanged in 2010. Overall since the mid 80s corporations have saved more than individuals each year. One important factor for the huge difference in personnel and corporate savings is globalization which reduced the salary levels of workers while companies benefited tremendously not only from cheap labor but also from explosive growth in overseas markets. As corporations are continuously finding more ways to cut costs while simultaneously raising prices or increasing sales, they will save more than governments and individuals.
