Relationship between Stock Market, GDP and Earnings

In an article last year on the relationship between economic growth and equity returns in emerging markets I wrote:

“In a study of 16 major markets by the Vanguard group, the correlation  between economic growth as measured by GDP per capita and long run stock returns since the 1900 was effectively zero.”

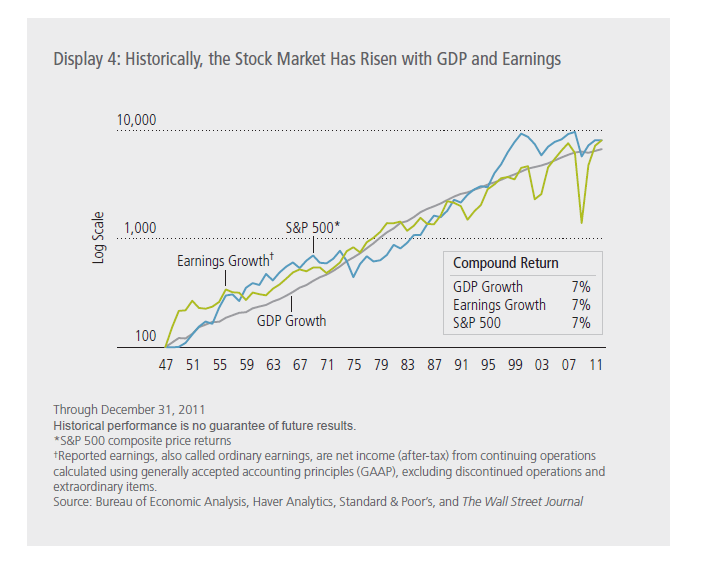
However a recent research by Alliance Bernstein on this subject noted that equity returns tend to rise with economic growth in the long-term for the US market.

Click to enlarge
From the report:

Historically, earnings and the stock market have grown with the economy over time, although they can diverge for several years at a stretch, particularly if market euphoria drives stock prices to very high multiples of earnings, or gloom drives stock prices to low multiples. Nominal US GDP2 (which includes inflation) has grown 7% a year onaverage since 1947—and so have the S&P 500’s earnings and price (Display 4).

Source: The Fundamental Case for the 20,000 Dow by Seth J. Masters, Bernstein Global Wealth Management
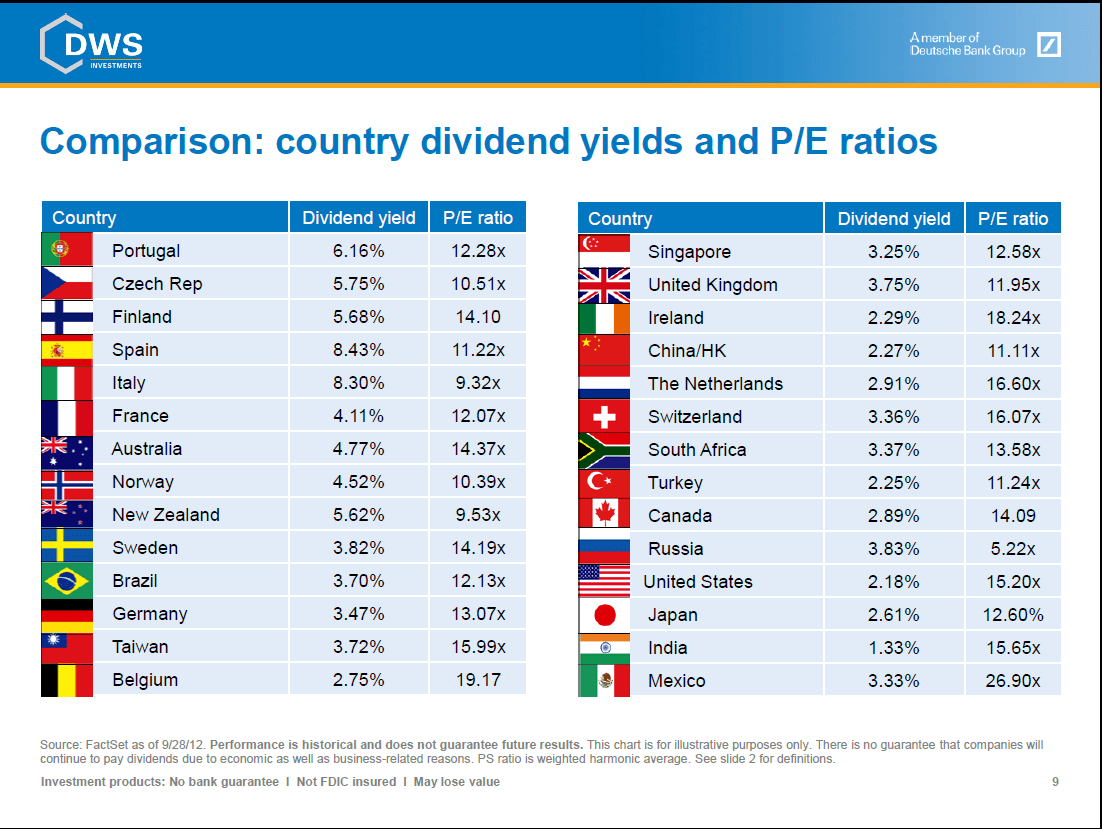
Dividend Yield and P/E Ratio by Country

The dividend yield and P/E ratios of select markets at the end of September, 2012 are shown in the graphic below:

Click to enlarge


Source: 

Income alternatives: The power of global dividends, DWS Investments

The U.S. dividend yield continues to stay at about 2%. Among the emerging markets India has he lowest dividend yield at 1.33%.

Some related ETFs:

iShares Dow Jones U.S. Select Dividend ETF (DVY)
PowerShares Dividend Achievers ETF (PFM)
Vanguard Dividend Appreciation ETF (VIG)
SPDR S&P Dividend ETF (SDY)

Disclosure: No Positions

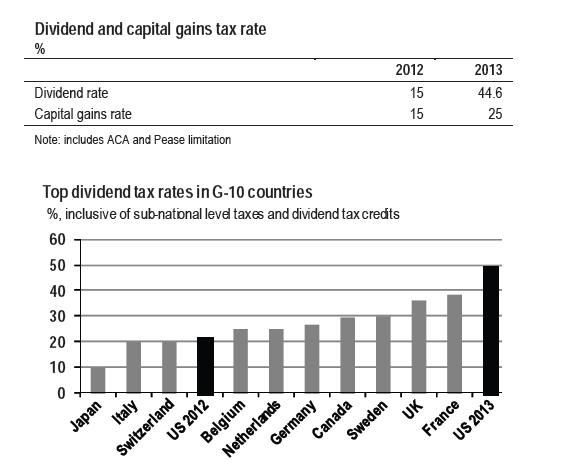
Comparing Top Dividend Tax Rates in G-10 Countries

The top dividend tax rate is currently 15% in the U.S. This 15% dividend tax rate is applicable to Qualified Dividends earned by all investors who fall in the 25% to 35% ordinary income tax range. Unless Congress takes action, the dividend tax rate is set to jump to the ordinary income tax rates on January 1, 2013. For people in the highest income tax category, this would mean a dividend tax rate of 39.6%.  When changes due to the Affordable Care Act and the re-introduction of the Pease limitation on itemized deductions are included, the top marginal dividend tax rate will reach 44.6% for those in the highest income tax brackets.

Click to enlarge

Comparison of Top Dividend Tax Rates among G-10 Countries:


Source:  Economic Research, Global Data Watch, October 5, 2012, J.P. Morgan

As shown in the chart above, the U.S. may end up having the highest dividend tax rates among the G-10 countries next year the current dividend tax rates are not extended.

Similar to the tax rate on dividends, the capital gains tax rate is also set to jump from the current 15% to 25% for those in the highest tax-brackets.

The research note from J.P. Morgan notes that one of the impacts of the rise in tax rates would be companies may opt to implement more share buybacks and pay fewer dividends to shareholders. Share buybacks is one of the worst  unproductive strategies followed by mostly U.S. companies that do not benefit shareholders for the most part. Hence investors may face a double whammy next year if dividend tax rates increase. This is because companies may not only pay fewer dividends but also waste excess earnings on buying back their own shares.

The Five Best and Worst Performing Foreign Banks YTD

Some of the emerging equity markets are performing well this year when compared to developed markets. Among the BRIC countries, India is the top performing market so year-to-date (YTD). Despite a growing economy, Brazil is lagging relative to other emerging countries due to political interference in certain sectors of the economy. Argentina is also under-performing due to political instability.  The YTD returns of select countries based on the MSCI indices are listed below:

  • Brazil: -5.55%
  • Russia: 9.06%
  • India: 21.25%
  • China: 12.04%
  • USA: 13.99%
  • Germany: 21.06%
  • UK: 8.95%

Accordingly Brazilian and Argentinian financials are in the negative territory YTD while financials from India have grown by double digits.

The five worst performing exchange-listed foreign bank ADRs YTD:

1.Company: Banco Macro (BMA)
YTD Change: -22.56%
Current Dividend Yield:  N/A
Country: Argentina

2.Company: Itau Unibanco (ITUB)
YTD Change: -21.50%
Current Dividend Yield: 4.21%
Country: Brazil

3.Company:BBVA Banco Frances (BFR)
YTD Change: -14.17%
Current Dividend Yield: N/A
Country: Argentina

4.Company:Banco Santander Brasil (BSBR)
YTD Change: -11.55%
Current Dividend Yield: 3.55%
Country: Brazil

5.Company:Banco Bradesco (BBD)
YTD Change: -5.28%
Current Dividend Yield: 3.72%
Country: Brazil

The five best performing exchange-listed foreign bank ADRs YTD:

1.Company:Lloyds Banking Group (LYG)
YTD Change: 65.61%
Current Dividend Yield: N/A
Country: UK

2.Company:National Bank of Greece (NBG)
YTD Change: 62.63%
Current Dividend Yield: N/A
Country: Greece

3.Company:ICICI Bank (IBN)
YTD Change: 53.61%
Current Dividend Yield: 1.46%
Country: India

4.Company:HDFC Bank (HDB)
YTD Change: 43.57%
Current Dividend Yield: 0.63%
Country: India

5.Company:Royal Bank of Scotland (RBS)
YTD Change: 42.23%
Current Dividend Yield: N/A
Country: UK

Note: Dividends and price changes noted are as of Oct 22, 2012

Disclosure: Long BBD, ITUB, BMA, LYG