The Current State of Global Equity Markets

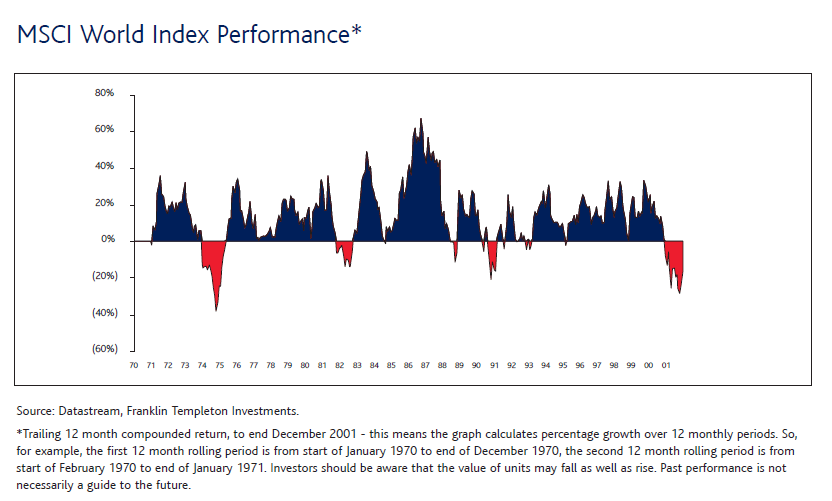
The S&P 500 Index fell by  37% in 2008 when the financial crisis hit the global equity markets. The index has yielded positive returns since with 26.46% in 2009, 15.06% in 2010 and 2.05% last year. The S&P 500 has shot up by 14.6 % so far this year.

In the years since the crisis, the real economy has not shown any significant improvement. For example, unemployment continues to be a major problem with about 12.5 million unemployed in August and the official unemployment rate remains stubborn at over 8%.  On the positive side of the equation, the number of bank failures declined to 92 in 2011 from 157 in 2010. This year only 43 banks failed year-to-date. The housing market has stabilized but will take years to reach pre-crisis levels. So the strong performance of the U.S. equity markets can be attributed mainly to liquidity due to the quantitative easing programs (QE1, QE2 and QE3) implemented by the Fed. Liquidity-driven markets tend to be highly volatile and can go high only as long as ample liquidity remains.

The following chart neatly illustrates  the current state of equity markets:

Click to enlarge


Source: Heads I win, Tails You Lose, by Avery Shenfeld, Chief Economist & Managing Director, CIBC World Markets

Why Gasoline Prices in the U.S. Vary Wildly

Gasoline prices at the pump tend to go up and down often in the U.S. Unlike other developed countries, the volatility of gas prices in the U.S. is high.

Brent crude closed at $112.39 on Friday and gasoline prices stood at an average of $3.79 per gallon nationwide.  From just under $3.50 per gallon last September the price has jumped to reach almost $4.00 now. In the same period, the price of crude oil has also increased. Since gas prices at the pump are tied to crude oil prices, as crude oil prices rise gas prices also rise. According to a research report by JP Morgan Asset Management, “the cumulative effect of a change in the price of crude oil in the price of gasoline at the pump is much larger in the U.S. than in other developed countries. Over the course of a year, about 80% of the original oil price shock is passed through to the pump price in the U.S., compared to 40% or less in the U.K., Germany and Japan.”

Click to enlarge Source: Inflation: In the eye of the beholder, JP Morgan Asset Management

Why do gasoline prices are so volatile compared to other countries?

The answer to the above question lies in taxes. It is no secret that the U.S. has the one lowest taxes on gasoline in the world. If taxes are higher like other countries, then most the price at the pump will be fixed thereby reducing high volatility.The above shows that U.S. gasoline taxes are below 20% of the purchase price. This is less than half of what consumers pay as taxes in the UK, Japan and Germany. Hence gasoline prices in the U.S. remain volatile than countries with higher gasoline taxes.

The Wall Street Journal published an article discussing the issue of gasoline taxes in this country. From the article “The Gas Tax Is Running Low. But What Should Replace It?“:

The gasoline tax is running on fumes.

For decades, the excise tax on gasoline and diesel fuel has been the main source of funds for building and maintaining the nation’s roadways. It has paid for most of the four million road miles currently in service.

.

Click to enlarge

But now there is agreement across the political spectrum that the gas tax is broken and needs to be replaced, or at least overhauled. The problem is twofold: First, the tax has failed to keep up with the rising cost of highway construction and repair. And second, improved fuel economy and the rise of hybrid and electric vehicles means that more driving won’t be matched by higher gasoline sales, and that how much people pay for the roads won’t necessarily reflect how much they use them.

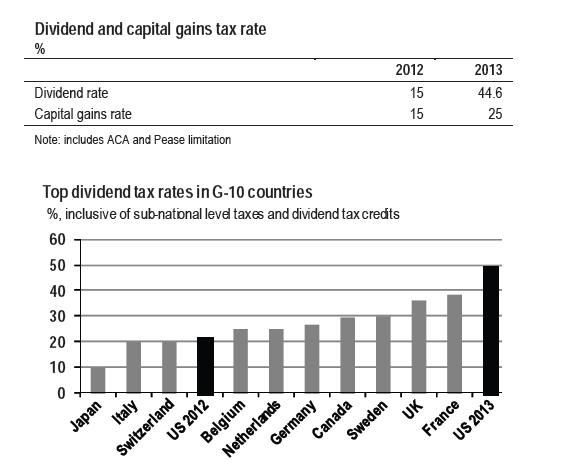
The gasoline taxes consumers pay at the pump is shared between the individual states and the Federal government. The Federal tax at 18.4 cents for gasoline and 24.4 cents for diesel has not changed since 1993, according to the journal article.  The chart above shows that the combined state and Federal taxes on gasoline at 50 cents or more per gallon is in effect in only some of the U.S. states. For a country that is heavily dependent on road transportation for the majority of the population policy makers have miserably failed  with regards to gasoline taxes. As in most other issues, consumers pay the price for this failure due to the constant volatility of gas prices at the pump.

Related ETFs:

United States Oil Fund (USO)
United States Gasoline Fund (UGA)

Disclosure: No Positions

Bank Director: America’s Top Banks for 2012 with Assests from $5 Billion to $50 Billion

The Bank Director magazine published their annual Bank Performance Scorecard for 2012 in July. The following are the top 10 banks with assets from $5 Billion to $50 Billion:

[TABLE=1124]

Source: Going For Gold: 2012 Bank Performance Scorecard, Bank Director

To download the full list of 75 banks in the ranking click here.

The mean Non-Performing Assets (NPAs)/Loans & Other Real-Estate Owned (OREO) is 8.90% which is high. Cullen/Frost Bankers, Inc (CFR) and Bank of Hawaii (BOH) are high quality banks which offer consistent long-term returns to shareholders.

Disclosure: No Positions

Bank Director: America’s Top Banks for 2012 with Assets from $1 Billion to $5 Billion

The Bank Director magazine published their annual Bank Performance Scorecard for 2012 in July. The following are the top 10 banks with assets from $1 Billion to $5 Billion:

[TABLE=1123]

Source: Going For Gold: 2012 Bank Performance Scorecard, Bank Director

To download the full list of 195 banks in the ranking click here.

The mean Non-Performing Assets (NPAs)/Loans & Other Real-Estate Owned (OREO) is 5.31%.

Disclosure: No Positions

Why European Stocks Look Attractive at Current Levels

Many major European indices have lagged the performance of the S&P 500 this year. Due to the ongoing fiscal crisis in Spain, Greece, Italy and other countries investors are apprehensive of investing in European stocks. Similar to U.S. companies, European companies are also in strong financial health as earnings reached record-high levels though they have slightly moderated in the recent quarters. This is not surprising since though many of these firms are based in Europe they have a strong presence in other countries especially in emerging countries. Hence their earnings are highly dependent on overseas markets than their domestic markets.

In addition to strong balance sheets, European companies are also attractive now based on P/E ratios according to an article in Citywire.  European stocks are trading well below their historical P/E ratios as shown in the chart below. Based on the 12 month forward P/E ratio also Europe is the cheapest compared to the major developed markets. Once the macroeconomic concerns die down there is significant room for growth in multiples.

Despite fear-mongering by the media, the Euro is unlikely to collapse and European companies will continue to remain strong. Mark Mobius, head of emerging markets at Templeton Investments was quoted in an article this week regarding this subject. From the article:

Mobius, who manages the £1.9bn Templeton Emerging Markets fund and has in recent years launched frontier markets and Africa funds – investing in the riskiest economies in the world – says that investors are shooting themselves in the foot with their risk-averse nature.

“The popular press is biased towards Europe and towards the world economy but the numbers don’t warrant that,” he explained.

“We are facing a long process of reform in Europe, but it will take place and Europe will emerge much stronger than it is now.”

Click to enlarge


Source: 10 reasons to consider investing in Europe: a special report, Citywire, UK

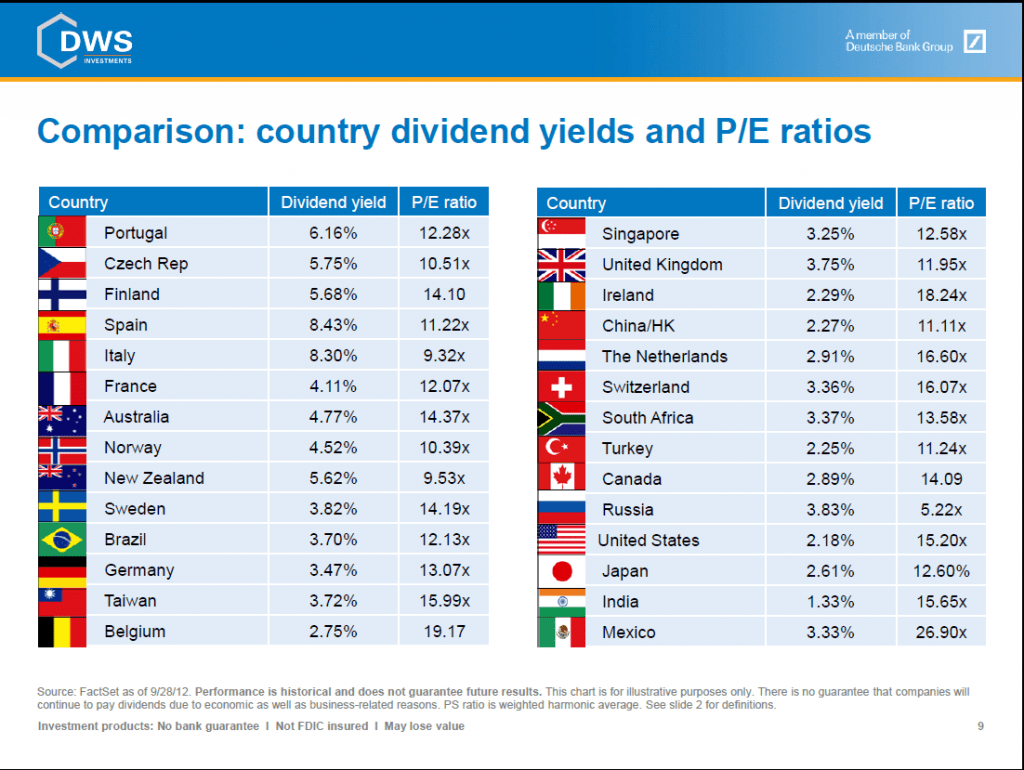
Ten European companies with exposure to countries outside of the continent are listed below together with their current dividend yields:

1. Company: Nestle SA (NSRGY)
Current Dividend Yield: 3.34%
Sector: Beverages (Nonalcoholic)
Country: Switzerland

2. Company: Unilever NV (UN)
Current Dividend Yield: 3.43%
Sector: Food Processing
Country:  The Netherlands

3. Company:Danone SA (DANOY)
Current Dividend Yield: 2.93%
Sector: Food Processing
Country:  France

4. Company: Diageo PLC (DEO)
Current Dividend Yield: 2.45%
Sector: Beverages (Alcoholic)
Country: The UK

5. Company: Tesco PLC (TSCDY)
Current Dividend Yield: 4.26%
Sector: Retail (Grocery)
Country: The UK

6. Company: Siemens AG (SI)
Current Dividend Yield: 3.89%
Sector: Electronic Instruments & Controls
Country: Germany

7. Company: Novo Nordisk A/S (NVO)
Current Dividend Yield: 1.59%
Sector: Biotechnology & Drugs
Country: Denmark

8. Company: Fresenius Medical Care AG (FMS)
Current Dividend Yield: 1.20%
Sector: Healthcare Facilities
Country: Germany

9. Company: ABB Ltd (ABB)
Current Dividend Yield: N/A
Sector: Electronic Instruments & Controls
Country: Switzerland

10. Company: BASF SE (BASFY)
Current Dividend Yield: 3.91%
Sector: Chemical manufacturing
Country: Germany

Note: Dividend yields noted are as of September 28, 2012

Disclosure: Long ABB