Conversion of Unsponsored ADRs to Sponsored ADRs Raises Investors’ Interest

In October 2008, the SEC changed a rule encouraging the establishment of more ADR programs. As a result of changes to the Rule 12g3-2(b), the number of Level 1 Sponsored and Unsponsored ADRs have soared. For example, before the rule become effective, there were 169 Unsponsored ADR(UADR) programs. After the rule change the number of UADRs have exploded with about 1,232 currently trading on the markets according to a research study by Deutsche Bank.

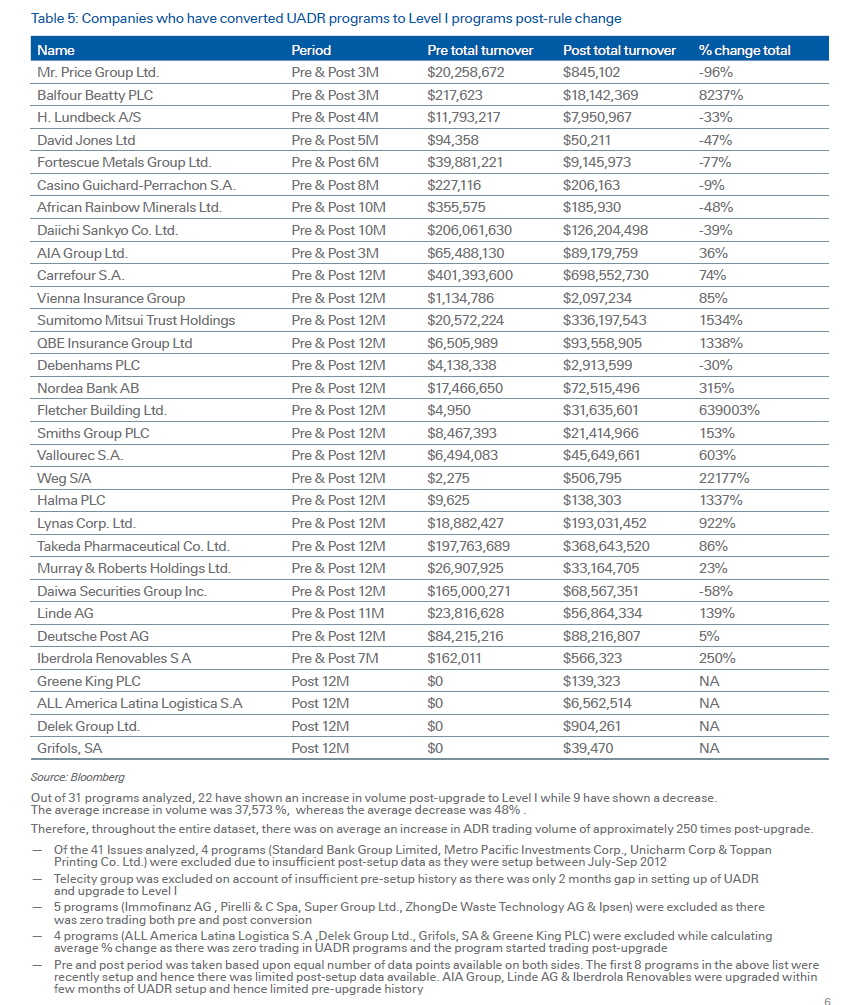
As a result of the SEC rule change many companies converted their UADRs to Level 1 programs. In the past 4 years, 41 companies have converted their UADRs to Level 1 programs. This change has triggered more investors’s interest in the ADRs as shown in the chart below:

Click to enlarge


Source:  Unsponsored ADRs: Evolution and opportunities, Deutsche Bank

The study noted that nearly three-fourths of the above programs saw a rise in turnover after the conversion.

The Top 16 European Chemicals Companies by Revenue

The chemicals sector is generally suitable for investment during any market condition due to the simple fact that chemicals are an essential ingredient in many of the products we use on a daily basis. For example, in a modern-day kitchen, chemicals are found in appliances, food items, packaging for foods, flooring, dish washing liquids, etc.

Some of the largest chemical firms in the world are based in Europe especially in Germany. The chemical industry is one of the largest industries in Germany and  many German firms hold leadership positions at a global level. In order to identify the top chemicals firm in the Euro zone, I I reviewed the EURO STOXX® Chemicals Index. The 16 components in the index are selected based on their revenues.

The long-term performance of the EURO STOXX® Chemicals Index is shown below:

Click to enlarge


Source: STOXX

The index is up about 21% year-to-date in US dollar terms with dividends reinvested.

The components of the index are listed below together with their ticker on the US markets and their current dividend yields:

S.No.CompanyTickerCountryDividend Yield as of Nov 13, 2012
1AIR LIQUIDEAIQUYFrance2.50%
2AKZO NOBELAKZOYThe Netherlands3.45%
3ARKEMAARKAYFrance1.70%
4BASFBASFYGermany4.12%
5BAYERBAYRYGermany2.56%
6BRENNTAGN/AGermanyN/A
7FUCHS PETROLUB PREFN/AGermanyN/A
8K + SKPLUYGermany3.75%
9KEMIRAN/AFinlandN/A
10KONINKLIJKE DSMRDSMYThe Netherlands3.44%
11LANXESSN/AGermanyN/A
12LINDELNEGYGermany1.99%
13SOLVAYSVYZYBelgium3.32%
14SYMRISESYIEYGermany2.32%
15UMICOREUMICYBelgium2.73%
16WACKER CHEMIEN/AGermanyN/A

Note: Dividend yields noted are as of Nov 13, 2012

I have excluded tickers of companies with very thin or no trading volumes. Air Liquide(AIQUY), BASF (BASFY) and Bayer(BAYRY) are also members of the the EURO STOXX 50 Index, the blue-chip index for the Eurozone.

Disclosure: Long AKZOY

Eight Ways To Profit From The Global Auto Sector Rebound

Automobile production and sales is increasing in many countries. Passenger auto sales in the U.S. has picked up in the past few months with over 6.0 million units through October this year representing a rise of 18.9% from 2011. In Europe though auto sales has been lower this year due to the recession and fiscal crisis in some countries. In emerging markets such as Brazil, China, India and others auto production and sales is rising although at a slower pace than before.

The Top Ten Countries in Automobile Production in 2011 are listed below:

RankCountryCarsCommercial vehiclesTotal% change
1China14,485,3263,933,55018,418,8760.80%
2Japan7,158,5251,240,1298,398,654-12.80%
3Germany5,871,918439,4006,311,3186.90%
4South Korea4,221,617435,4774,657,0949.00%
5India3,038,332888,1853,926,51710.40%
6USA2,966,1335,687,4278,653,56011.50%
7Brazil2,534,534871,6163,406,1500.70%
8France1,931,030363,8592,294,8892.90%
9Spain1,819,453534,2292,353,682-1.40%
10Russia1,738,163249,8731,988,03641.70%


Source: International Organization of Motor Vehicle Manufacturers

In 2011 a total of 59,946,698 autos were produced globally representing an increase of 3.1% over 2010. It is interesting to note that China was ranked number one while the U.S. came in at number six behind India. The U.S. production figure represents 4.9% of the total world production and China’s production accounted for 24.2% of the world production.

A few other interesting facts about the global auto industry include:

Cars (or automobiles) make up approximately 74% of the total motor vehicle annual production in the world.

In 2012, for the first time in history, over 60 million cars passenger cars will be produced in a single year (or 165,000 new cars produced every day).

1 out of 4 cars produced in the world comes from China.

Furthermore, vehicle penetration in China still stands at only about 40 vehicles per 1,000 people, compared with approximately 700 vehicles per 1,000 people in the mature markets of the G7.

In the United States alone, 250,272,812 “highway” registered vehicles were counted in 2010, of which 190,202,782 passenger cars.

It is estimated that over 1 billion passenger cars travel the streets and roads of the world today.

Source: WorldOMeters

How to profit from the growth of the auto industry worldwide?

During the California gold rush of the 1800s most of the miners did not become rich. Instead the people  that sold shovels and other tools to the gold miners were the ones that became wealthy. This type of investment strategy is a better way to invest in the auto industry.Instead of investing in the auto makers, it is prudent to invest in the companies that sell the tools and accessories to the auto makers and also to consumers.So instead of investing directly in a Ford(F) or General Motors Company (GM) one can invest in the makers of oxygen sensors, tires, windshields, etc. that are used in the assembly of cars.

Eight foreign automobile parts manufactures are listed below together with their current dividend yields:

1.Company: Autoliv Inc (ALV)
Current Dividend Yield: 3.53%
Country: Sweden

2.Company:Magna International Inc (MGA)
Current Dividend Yield: 2.45%
Country: Canada

3.Company: Bridgestone Corp (BRDCY)
Current Dividend Yield: 1.54%
Country: Japan

4.Company: Compagnie Generale des Etablissements Michelin SCA (MGDDY)
Current Dividend Yield: 3.16%
Country: France

5.Company: Continental AG (CTTAY)
Current Dividend Yield:
Sector: 2.05%
Country: Germany

6.Company: Denso Corp (DNZOY)
Current Dividend Yield: 1.95%
Country: Japan

7.Company: Nokian Renkaat Oyj (NKRKY)
Current Dividend Yield: 4.01%
Country: Finland

8.Company: Valeo SA (VLEEY)
Current Dividend Yield: 4.22%
Country: France

Note: Dividend yields noted are as of Nov 12, 2012

Disclosure: Long VLEEY,DNZOY

Are Emerging-Markets Stocks Attractive Based on Price-to-Book Ratio?

Emerging market stocks soared before the global financial crisis leading to sky-high valuations and equity prices. Investors’ attraction towards emerging markets has since changed dramatically. This year many of the leading emerging market indices are still in the negative territory are up only slightly compared to developed markets.

The year-to-date returns of some of the emerging market indices are listed below:

  • China’s Shanghai Composite: -5.9%
  • India’s Bombay Sensex: 20.9%
  • Brzail’s Sao Paulo Bovespa: 1.1%
  • Chile’s Santiago IPSA: 1.4%
  • Mexico’s IPC All-Share: 9.7%

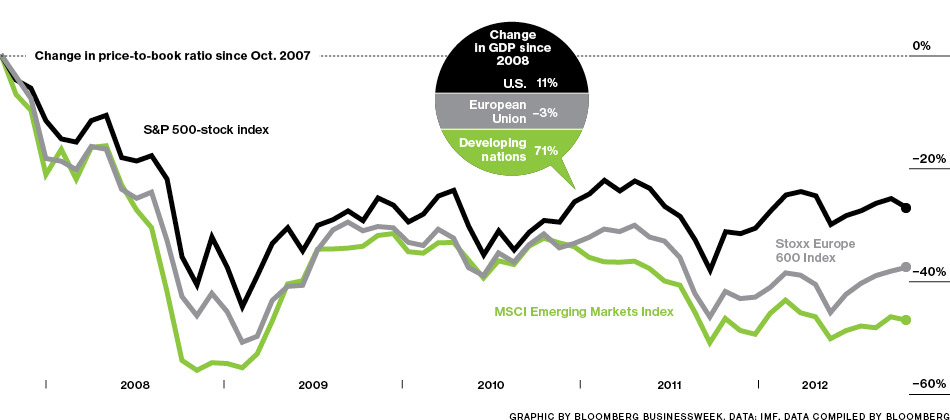
Since the financial crisis,  while developed countries have experienced average to poor growth, the economies of emerging countries have continued to grow strong though at a lesser pace than before. This is due to a multitude of reasons some of which include rising household income, higher employment, stable and better banking system,  low public debt, implementation of political and economic reforms, infrastructure development, etc. However despite the higher economic growth than developed countries, emerging markets have been re-rated by investors and equities in those markets have fallen more based on the price-to-book ratio than developed countries.

Click to enlarge


Source:  Emerging-Market Stocks: The Deepest Dive, Bloomberg BusinessWeek

Many research studies confirm that higher economic growth do not necessarily lead to higher equity prices.So investing in emerging stocks mainly based on economic growth is not a wise strategy. However in the current scenario, some additional factors favor emerging equities over developed equities. For example, many emerging companies are becoming global players and have higher earnings but lower dividend payout ratios. Hence they have the potential to raise payouts in the future. Dividend culture is also being slowly embraced in many of these countries. Another reason emerging stocks are attractive at current levels is that domestic consumption of goods and services is increasing and companies that cater to the domestic market instead of mainly depending on exports stand to benefit from this growth.

Ten emerging market stocks with dividend yields of more than 3% are listed below for further review:

1.Company:Empresa Nacional de Electricidad SA (EOC)
Current Dividend Yield: 3.44%
Sector: Electric Utilities
Country: Chile

2.Company: Banco Latinoamericano de Comercio Exterior SA (BLX)
Current Dividend Yield: 5.61%
Sector: Banking
Country: Panama

3.Company:Telefonica Brasil SA (VIV)
Current Dividend Yield: 5.60%
Sector: Telecom
Country: Brazil

4.Company:Cpfl Energia SA (CPL)
Current Dividend Yield: 6.85%
Sector: Electric Utilities
Country: Brazil

5.Company: Enersis SA (ENI)
Current Dividend Yield: 3.42%
Sector: Electric Utilities
Country: Chile

6.Company:Sasol Ltd (SSL)
Current Dividend Yield: 4.86%
Sector:Chemical Manufacturing
Country: South Africa

7.Company: Philippine Long Distance Telephone Co (PHI)
Current Dividend Yield: 4.62%
Sector: Telecom
Country: Philippines

8.Company:Malayan Banking Bhd (MLYBY)
Current Dividend Yield: 7.18%
Sector: Banking
Country: Malaysia

9.Company:China Construction Bank Corp (CICHY)
Current Dividend Yield: 5.07%
Sector:Banking
Country: China

10.Company:Banco do Brasil SA (BDORY)
Current Dividend Yield: 7.88%
Sector:Banking
Country: Brazil

Note: Dividend yields noted are as of Nov 9, 2012

Disclosure: Long ENI