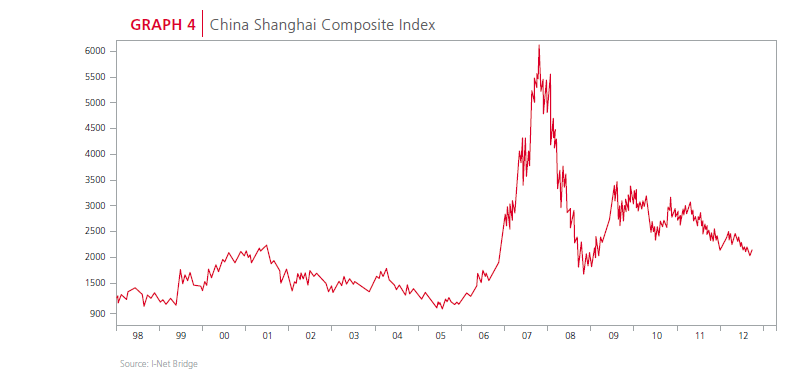
Equity Market Performance Comparison: Brazil vs. Mexico

Brazil has been the hot emerging market destination until recently. The country’s economy and stocks performed extremely well due to the commodity market boom before the global financial crisis. However global investors’ attraction towards Brazil has waned recently despite many positive factors favorable to the economy including the hosting of Olympic Games in 2016 and the World Cup in 2014. In terms of equity market returns, compared to the S&P 500’s rise of 15.0% year-to-date (YTD), the Brazilian benchmark Bovespa index has gained only 4.3%.

The Mexican economy stabilized and expanded under the leadership of outgoing President Felipe Calderon despite the bloody violence due to drug cartels. Mexico’s IPC index is up about 11.0% YTD and the index may go up higher as a result of the economic reforms promised by the incoming President Enrique Pena Nieto.

Over long term also Mexican stocks have yielded higher returns than Brazilian stocks. This may come as a surprise to many investors since the Mexican economy is highly dependent on the U.S. economy which is experiencing lackluster growth in recent years. The superior performance of Mexico relative to Brazil is more interesting considering the limited natural resources available in Mexico relative to Brazil and the ongoing drug violence.

Performance comparison of IPC Index and Bovespa over 5 years:

Click to enlarge

In the past 5 years, the IPC has returned 30.62% while  Bovespa has lost about 5%.


Performance comparison of IPC Index and Bovespa from 2001 to YTD:


Since 2001, Mexico’s IPC Index has shot up nearly six-fold. During the same period Bovespa went up only 260%. The U.S. market lagged both Mexico and Brazil by a significant margin. The S&P 500 rose just 11% in the same time.

Related ETFs:
iShares MSCI Brazil Index (EWZ)
iShares MSCI Mexico Investable Market Index (EWW)
SPDR S&P 500 ETF (SPY)

Disclosure: No Positions

The Top 15 British Dividend Paying Stocks

Many British companies are increasing dividend payments this year. According to a report by Capita Registrars, large British firms are projected to payout a record £78.3 billion in dividends. In the first half £41.4 billion was paid out in dividends including special dividends by GlaxoSmithkline and Old Mutual. Oil majors were some of the biggest dividend raisers.

The Top 15 Companies based on dividends paid in the first of 2012 are listed below with the ADR ticker if available:

[TABLE=1136]

Source: Capita Registrars UK Dividend Monitor, Issue 12, Capita Registrars Limited

Disclosure: No Positions

South Africa’s Standard Bank Group Starts Sponsored ADR Program

South Africa-based Standard Bank Group has established a sponsored American Depositary Receipt (ADR) program effective September 28, 2012 with the ticker SGBLY. Earlier the company traded as an unsponsored DR on the OTC market.

From the BNY Mellon press release:

Founded in 1862 and headquartered in Johannesburg, Standard Bank Group is the largest African bank by assets and earnings.  Standard Bank offers a range of banking and related financial services in 18 countries on the African continent as well as in other select emerging markets. The company has 1,222 branches, including loan centers, and 7,945 ATMs across Africa.  Standard Bank employs more than 52,000 people across all geographies and has a market capitalization of about $20 billion.

“We are delighted to partner with BNY Mellon in establishing a sponsored ADR program and to be traded on the U.S. OTC market,” said Simon Ridley, CFO of Standard Bank Group.  “There is great scope for the expansion of banking services in sub-Saharan Africa, and this ADR program is an exciting new source of potential investors to drive our growth strategy.”

Currently, 36 of the Johannesburg Stock Exchange ‘Top 40’ constituents, by market cap, have a DR program.  BNY Mellon is depositary for 30 of those.  Standard Bank Group is the fifth new South African sponsored DR program established by BNY Mellon since June.

The bank’s latest Tier 1 capital adequacy ratio stands at 11%. Foreign shareholders hold 46.2% of the total outstanding shares with  China’s Industrial and Commercial Bank of China holding a large stake of 20.1%. The bank’s total assets stood at about US $ 189.0 billion as of June 30, 2012.

Standard Bank Group Ltd (SGBLY) closed at  $12.80 and has a dividend yield of 9.85%.

For more information please visit their investor relations site.

Disclosure: No Positions

Relationship Between a Country’s Regulation and Income

A research study by The Fraser Institute of Canada in 2010 confirmed that a country’s incentive structures which include variables such as labor market flexibility, economic freedom, the quality of the legal system and the intrusiveness of the government into the business sector has a significant impact on wealth and income. More specifically the study found that  lower regulation leads to higher income and vice versa.

The following chart shows the relationship between regulation and income:

Click to enlarge

Via The Absolute Return Letter, September 2012, Absolute Return Partners LLP

The highly regulated BRIC countries have lower income.Germany has more regulation than other developed European countries. Portugal, Greece and Italy are just slightly better than BRIC counties in terms of regulations. For example, labor laws in Italy are some of the most restrictive anywhere in the world. From an article in The Wall Street Journal:

Italy’s 1970 labor laws gave legal credence to the idea of the “posto fisso,” or lifetime job, an institution that has been blamed recently for harming productivity growth and discouraging business investment.

The U.S. has the highest income per capita due to the highly de-regulated economy. The government rarely gets involved in the operations of businesses and both the political parties adhere to the belief that less state intervention in the private sector is better. Hence most the regulatory agencies exist to make sure that the markets are operating efficiently and leave the  industries to self-regulate themselves through industry-funded groups. This includes some of the major agencies such as the SEC, CTFC and other alphabet soup of government entities at the federal and state levels. Low regulations and the ability to hire and fire workers allow companies to thrive which in turn leads to higher income per capita at the national level. The flexible labor market keeps the economy dynamic in the sense that companies can lay off workers when the economy is in contraction mode and hire them when needed.

Nordic Stocks Offer Investment Opportunities

The Nordic countries of Denmark, Finland, Norway and Sweden are somewhat insulated from the crises engulfing Europe. These countries are not member of the European Monetary Union (EMU) and hence do not have the Euro as their currency. Staying outside of the Eurozone the Nordics set their own economic policies according to their national priorities. These countries have many positive factors such as strong fiscal position, low to no public debts,low unemployment rates, stable currencies, etc. Hence investors looking to gain some exposure to European companies may want to consider adding some Nordic stocks.

The Nordic equity markets have traditionally performed better than other the markets in European countries.

Click to enlarge

Source: Nordics dodge the debt crisis, Fidelity

Finland has the highest annual returns at over 9.0% among the Nordics. However currently Swedish and Norwegian economies are in better shape than the economies of Finland and Denmark.

From an investment perspective, it is wise to avoid Danish banks.A few regional banks have failed since the credit crisis and though the contagion did not spread major national banks, investors can avoid the sector for now. While the central banks of many countries reduced the interest rates to zero, Denmark went even further and set the interest rates to negative earlier this year. The public debt is low and the kroner has strengthened against the Euro this year.The economy is diversified
with drug, green technology, farm products and other industries. (Source: Denmark’s Subzero Rate Adventure, Bloomberg BusinessWeek)

The Norwegian economy is highly dependent on crude oil exports but the country has built a solid sovereign fund using oil revenues. Oil prices have recovered strongly in the past few months and is unlikely to collapse unless the global economy falls back into recession. Norway also has no debts.

The Swedish and Finnish economies are also in better shape than most European economies.The Swedish banking
sector has rebounded nicely since the financial crisis and is returning to pre-crisis levels.A recent journal article discussed about how the Swedish banking sector is benefiting from the flight of deposits from Eurozone countries.

Only a handful of Nordic stocks trade on the organized exchanges. Hence investing in stocks directly is a challenge and investors have to go to the OTC markets where many of the stocks are traded. For those who prefer the ETF route, the iShares MSCI Sweden Index(EWD), Global X Funds(NORW) , iShares MSCI Finland Capped Investable Market (EFNL) and iShares MSCI Denmark Capped Investable Market (EDEN) ETFs offer easier access to these markets.

Some of the Nordic stocks trading on the US markets are listed below:

1.Company: NOVO NORDISK A/S (NVO)
Current Dividend Yield: 1.59%
Sector: Health Technology
Country: Denmark

2.Company: STATOIL ASA (STO)
Current Dividend Yield: 4.14%
Sector: Energy Minerals
Country: Norway

3.Company: CARLSBERG A/S (CABGY)
Current Dividend Yield: 1.08%
Sector: Alcoholic Beverages
Country: Denmark

4.Company: DNB NOR ASA (DNHBY)
Current Dividend Yield: 2.83%
Sector: Banking
Country: Norway

5.Company: ELECTROLUX AB (ELUXY)
Current Dividend Yield: 3.86%
Sector: Consumer Durables
Country: Sweden

6.Company: FORTUM OYJ (FOJCY)
Current Dividend Yield: 7.13%
Sector: Utilities
Country: Finland

7.Company: SWEDISH MATCH AB (SWMAY)
Current Dividend Yield: 2.27%
Sector: Consumer Non-Durables
Country: Sweden

8.Company: NOKIAN TYRES OYJ (NKRKY)
Current Dividend Yield: 3.82%
Sector: Consumer Durables
Country: Finland

9.Company: SVENSKA HANDELSBANKEN AB (SVNLY)
Current Dividend Yield:
Sector: Banking
Country: Sweden

10.Company: SWEDBANK AB (SWDBY)
Current Dividend Yield: N/A
Sector: Banking
Country: Sweden

11.Company: PETROLEUM GEO-SERVICES ASA (PGSVY)
Current Dividend Yield: 1.12%
Sector: Oil Well Services & Equipment
Country: Norway

12.Company: SCANIA AB (SVKBY)
Current Dividend Yield: 3.92%
Sector: Producer Manufacturing
Country: Sweden

13.Company: STORA ENSO OYJ (SEOAY)
Current Dividend Yield: 6.22%
Sector: Process Industries
Country: Finland

14.Company: TELIASONERA AB (TLSNY)
Current Dividend Yield: 5.87%
Sector: Telecom
Country: Sweden

15.Company: YARA INTERNATIONAL ASA (YARIY)
Current Dividend Yield: 2.33%
Sector: Process Industries
Country: Norway

Note: Dividend yields note are as of Oct 1, 2012

Disclosure: Long SWDBY, FOJCY, EWD