BNY Mellon and OTC Markets Group joined forces together and launched the first-ever OTC ADR Index last month. From the OTC Markets Newsletter:
Today, a wide variety of ADRs — more than 1,400 — trade on the OTCQX®, OTCQB® and OTC Pink®marketplaces, a fivefold increase from just 10 years ago. In the first nine months of 2012, 251 new OTC ADR programs were established. This includes companies in every industry from almost every country across the globe.
To highlight all the great ADRs trading on our marketplaces, this month we partnered with BNY Mellon, the global leader in investment management and investment services, to launch the OTCM ADR Index, the first-ever index of ADRs traded on the OTCQB, OTCQB and OTC Pink marketplaces.
The Index, which can be found under the ticker symbol “OTCDR” on most data terminals, is designed to benchmark the fast-growing and diverse number of ADR investment opportunities available to investors through their U.S. brokers. It is comprised of 535 large-cap international companies traded on our marketplaces. In all, 38 countries are represented across 10 industries.
The number of stocks trading on the OTC markets is growing every year as more foreign companies move to list there and more smaller domestic firms start trading publicly.For example, from Jan 2, 2013 India’s Mahanagar Telephone Nigam Limited moved to the OTCQX market from the NYSE.Currently it trades under the ticker MTENY. As of November 30, 2012 the premier market known as the OTCQX market has 401 listed and the OTCQB and OTC Pink markets had 3,349 and 2,449 companies listed. About 1,600+ dividend-paying companies trade on these markets.
The Top 10 Components of the OTCM ADR Index are listed below:
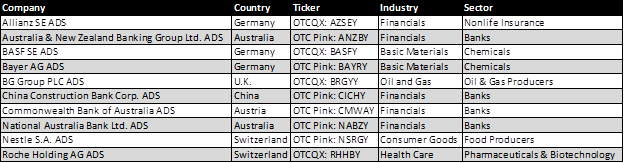
Source: OTC Markets Newsletter
The launch of this index is a positive development for OTC Markets as more investors would become aware of some of the top foreign companies such as the above ten trading in the markets. Already there is talk of an ETF getting launched based on this index according to an article in the ETF Strategy site.
Disclosure: No Positions