Chart: Natural Catastrophes Worldwide From 1980 to 2011

Germany-based reinsurance company Munich Re (MURGY) maintains the world’s largest database on global catastrophes. The company operates in most countries and earns over half of its disaster insurance premiums from the U.S. In October last Munich Re published a research study on climate changes.

From the report in Der Spiegel:

Whether it’s hurricanes, thunderstorms or tornadoes, extreme weather is big business for insurers. Now German re-insurer Munich Re claims to have found proof that man-made climate change is causing more weather catastrophes in North America. Scientists are outraged.

In late October of last year, superstorm Hurricane Sandy hit the US causing an estimated $25.0 billion in damages and more than 100 deaths. Sandy is the latest natural catastrophe to cause billions in damages.

Globally meteorological and hydrological catastrophic events are increasing since the 1980s. Here is chart showing the count of worldwide natural catastrophes worldwide from 1980 to 2011 :

Click to enlarge
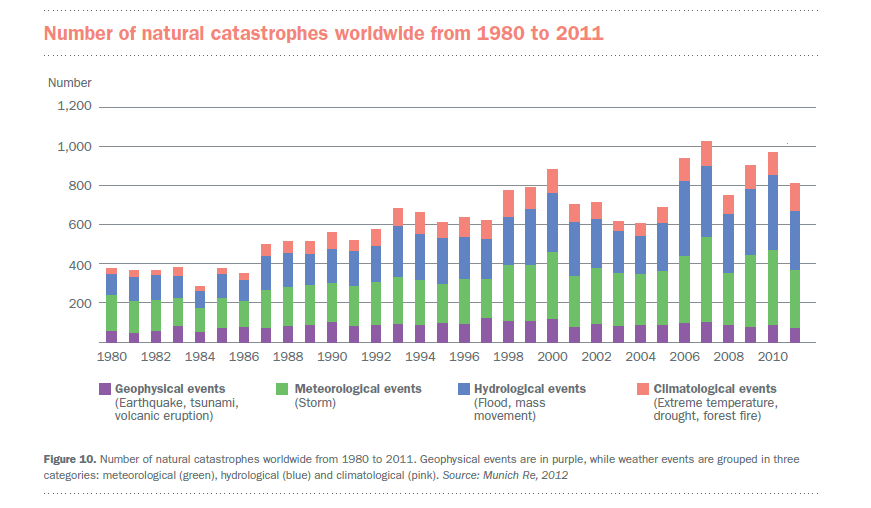
Natural-Cats-by-Year

Source: Munich Re 

Disclosure: No Positions
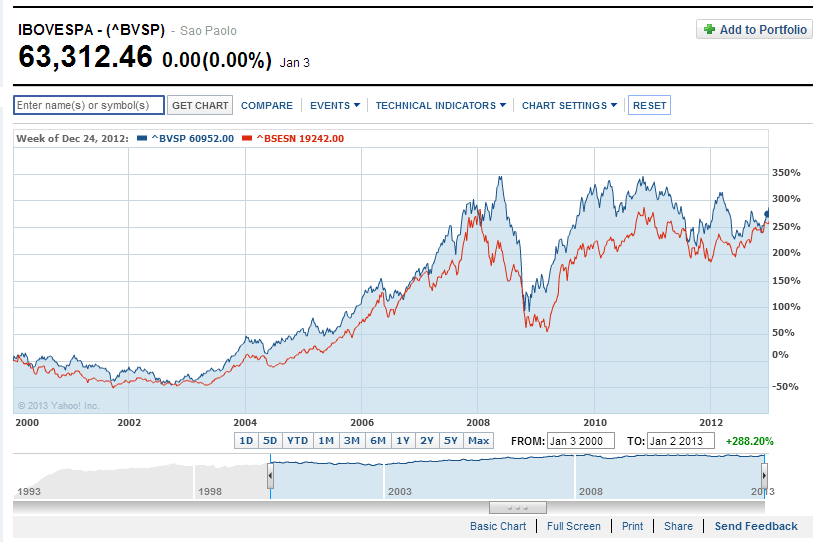
Comparing the Performance of Sensex and Bovespa Indices

Last year India’s  was one of the best performing emerging markets with the Sensex rising about 26%. Brazil had a lackluster performance with the Bovespa gaining under 8% for the year. Though both are part of the BRIC countries, the economies of Brazil and India differ vastly. For example, India is a major importer of commodities while Brazil is a major exporter. Though domestic consumption is increasing in both countries, the unemployment rate is lower and consumer credit growth is growing at a faster pace in Brazil than in India. It would be interesting to see how these two economies perform this year.

The chart below shows the performance of Bovespa and Sensex since 2000:

Click to enlarge

Bovesap-Sensex

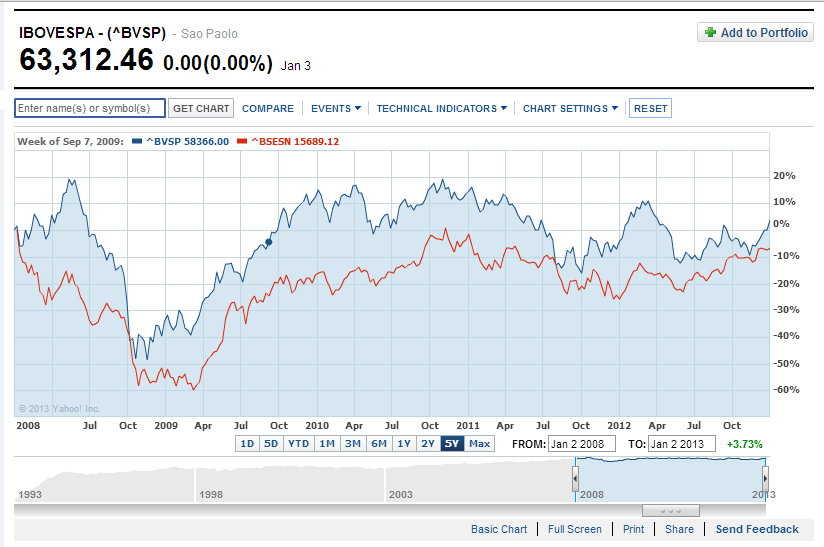
In the past 5 years Brazil’s Bovespa has outperformed the Sensex:

Bovesap-Sensex-5-Years

Source: Yahoo Finance

Mexico outperformed both Brazil and Chile last year since the Mexican economy is more  connected to the US economy than the economies of Brazil and Chile. Mexico’s IPC index reached a new record high this year.

Related ETFs:

WisdomTree India Earnings (EPI)
PowerShares India (PIN)
iShares S&P India Nifty 50 (INDY)
EGShares Brazil Infrastructure ETF (BRXX)
iShares MSCI Brazil Index (EWZ)

Disclosure: No Positions

First-Ever OTC ADR Index Launched

BNY Mellon and OTC Markets Group joined forces together and launched the first-ever OTC ADR Index last month. From the OTC Markets Newsletter:

Today, a wide variety of ADRs — more than 1,400 — trade on the OTCQX®, OTCQB® and OTC Pink®marketplaces, a fivefold increase from just 10 years ago. In the first nine months of 2012, 251 new OTC ADR programs were established. This includes companies in every industry from almost every country across the globe.

To highlight all the great ADRs trading on our marketplaces, this month we partnered with BNY Mellon, the global leader in investment management and investment services, to launch the OTCM ADR Index, the first-ever index of ADRs traded on the OTCQB, OTCQB and OTC Pink marketplaces.

The Index, which can be found under the ticker symbol “OTCDR” on most data terminals, is designed to benchmark the fast-growing and diverse number of ADR investment opportunities available to investors through their U.S. brokers. It is comprised of 535 large-cap international companies traded on our marketplaces. In all, 38 countries are represented across 10 industries.

The number of stocks trading on the OTC markets is growing every year as more foreign companies move to list there and more smaller domestic firms start trading publicly.For example, from Jan 2, 2013 India’s Mahanagar Telephone Nigam Limited moved to the OTCQX market from the NYSE.Currently it trades under the ticker MTENY. As of November 30, 2012 the premier market known as the OTCQX market has 401 listed and the OTCQB and OTC Pink markets had 3,349 and 2,449 companies listed. About 1,600+ dividend-paying companies trade on these markets.

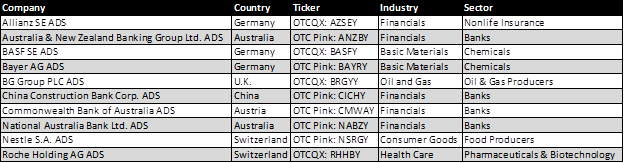
The Top 10 Components of the OTCM ADR Index are listed below:

OTCM-ADR-Index-Top-10

Source: OTC Markets Newsletter

The launch of this index is a positive development for OTC Markets as more investors would become aware of some of the top foreign companies such as the above ten trading in the markets. Already there is talk of an ETF getting launched based on this index according to an article in the ETF Strategy site.

Disclosure: No Positions

Invest in Infrastructure Stocks

What are the advantages of investing in the infrastructure industry?

High barriers to entry;
Economies of scale (e.g., high fixed, low variable costs)
Inelastic demand for services (giving pricing power)
Low operating cost and high target operating margins; and
Long duration (e.g., concessions of 25 years, leases of 99 years)

Second, here is the value proposition:
Attractive returns
Low sensitivity to swings in the economy and markets
Low correlation of returns with other asset classes
Long-term, stable and predictable cash flows
Good inflation hedge
Low default rates; and
Socially responsible investing.

Source: Canadian Investment Review

Here are five foreign infrastructure stocks to consider:

1.Company: Vinci SA (VCISY)
Current Dividend Yield: 4.58%
Country: France

2.Company: Chicago Bridge and Iron Company NV (CBI)
Current Dividend Yield: 0.42%
Country: The Netherlands

3.Company: Hochtief AG (HOCFY)
Current Dividend Yield: N/A
Country: Germany

4.Company:Skanska AB (SKSBY)
Current Dividend Yield: 5.57%
Country: Sweden

5.Company: JGC Corp (JGC)
Current Dividend Yield: 1.51%
Country: Japan

Related ETF:

First Trust ISE Global Engineering and Construction Index Fund (FLM)

Disclosure: Long VCISY

Are Italian Stocks Attractively Valued Now?

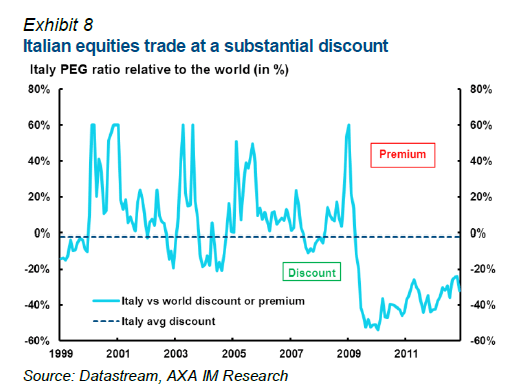
Italy’s benchmark FTSE MIB Index rose 9.04% in 2011. This is lower then other European indices such as Germany’s DAX which had an excellent run. According to a research report by AXA Investment Managers, Italian stocks are trading at a substantial discount relative to their global peers. Though the discount has decreased since the depth of the financial crisis it is still below the average discount.

Click to enlarge

Italy-Stocks-PEG-Ratio

Source: Special 2013 Outlook, AXA Investment Managers

Italy has a lower P/E  relative to most PIIGS countries. Italian stocks’ P/E ratio stood at 13.9 on Dec 28, 2011. Portugal, Ireland,  Greece and Spain’s P/E ratios were 17.7, 10.4, 14.8 and 12.5 respectively per FT market data.

Italian politics is a mess with the  Prime Minister  Mario Monti resigning recently and elections due to be held this year. Former Prime Minister billionaire Silvio Berlusconi is planning to run again for office. The economy is in a poor shape as well. From a news report in CNN:

Italy is in a recession, and further belt-tightening will be unpopular with its citizens.

The unemployment rate in Italy rose to 11.1% in October, marking a 13-year high, and the Italian economy has contracted for five consecutive quarters. As of the third quarter, its economic growth was down 2.4% from a year earlier.

Nine Italian firms that made it to the Fortune Global 500 list in 2012 are listed below with their tickers if available and current dividend yields:

1.Company: ENI Spa(E)
Current Dividend Yield: 5.46%

2.Company: EXOR Group

3.Company: Assicurazioni Generali (ARZGY)
Current Dividend Yield: 1.74%

4.Company: Enel (ENLAY)
Current Dividend Yield: 8.05%

5.Company:UniCredit Group (UNCFY)
Current Dividend Yield: N/A

6.Company: Intesa Sanpaolo (ISNPY)
Current Dividend Yield: 3.54%

7.Company: Telecom Italia (TI)
Current Dividend Yield: 5.96%

8.Company: Poste Italiane

9.Company: Finmeccanica (FINMY)
Current Dividend Yield: N/A

Note:Dividends noted are as of Dec 31, 2012

The iShares MSCI Italy ETF(EWI) has most of the companies noted above in the top 10 holdings. The fund has total assets of $370 Mil. and a distribution yield of 3.28%. As with many country specific ETFs, financials account for over one-fourth of the portfolio.

To answer my title question, I would say that while the whole market is trading at a discount based on technical  investors have to be still very selective if willing commit new money on Italian stocks. For example, the integrated utility Enel appears to be strong among European utilities to continue paying dividends this year without cutting payouts or borrowing funds as per a report in The Wall Street Journal.

Disclosure: Long EWI