Welcome to the first post on TopUSStocks.com ! (no longer exists).
The equity markets have been volatile in the past few years since the global financial crisis. As a result of the stomach-churning fall during the crisis and the volatility that followed some investors have simply thrown in the towel and left the equity markets. Others have lost their trust in the buy and hold strategy which worked well in the past when the markets were “normal”.
However in an article last December Kurt Feuerman of AllianceBernstein notes that such buy-and-hold is still alive and works. So investors trying to time the market or trade often may not earn higher returns they were hoping to attain. From Kurt’s post:
Individual and institutional investors have been cutting exposure to equities and other risk assets for years. This de-risking took place as stock valuations were declining. For example, the price-to-earnings ratio of the S&P 500 Index at the beginning of the 2000s was about 30; now, it’s 15. There were many reasons for the equity downsizing, but the bottom line is that investors were shedding stocks as stocks were actually getting cheaper.
These investors haven’t taken part in the post-crisis rebound—as long-term buy-and-hold investors have. Including 2012, US equity markets have risen for four straight years. As seen in the display below, the S&P 500 Index even reached an all-time high in August 2012. It wasn’t the better-known S&P 500 price index that set the mark, but the total-return version that includes dividend payments and their reinvestment. In other words, a benchmark that’s more relevant to long-term investing reached an all-time high. There didn’t seem to be much mention of this in the financial media, which remained preoccupied with macro and political concerns.
Click to enlarge
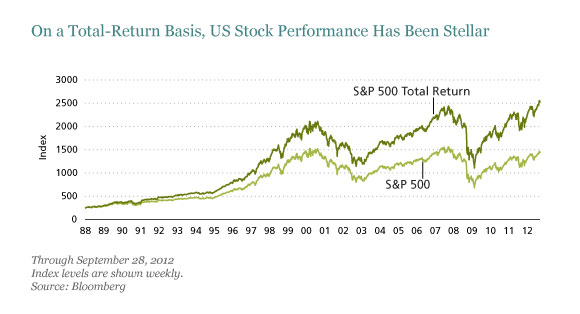
Source: Buy and Hold Is Dead…Long Live Buy and Hold, AllianceBernstein
It is surprising to note that the S&P 500 Total Return reached an all-time high last year – just a few years after one of the worst bear markets since the Great Depression.
In order to take advantage of the buy-and-hold philosophy investors have to be very selective in picking stocks and industries. For example, utilities and consumer staples are better to hold for the long-term than say IT or biotech stocks. Though utility stocks have historically had high yields, they are not the best performers over the long-term among the many S&P sectors. The consumer staples sector -specifically the food sector – is an excellent choice for investors looking for stability, conservative yields and planning to hold stocks for many years.
Six food stocks to consider adding to a well-diversified portfolio:
1.Company: ConAgra Foods Inc (CAG)
Current Dividend Yield: 3.31%
2.Company: General Mills Inc (GIS)
Current Dividend Yield: 3.16%
3.Company:Kellogg Co (K)
Current Dividend Yield: 3.11%
4.Company:H.J. Heinz Co (HNZ)
Current Dividend Yield: 3.51%
5.Company:Campbell Soup Co (CPB)
Current Dividend Yield: 3.25%
6.Company:The Hershey Co (HSY)
Current Dividend Yield: 2.25%
Note: Dividend yields noted are as of Jan 4, 2013
Disclosure: Long GIS