Stock Market Participation Rates Across Countries

For many years I have been wondering about the stock market participation rates across countries. At a high level we know that certain countries have high level of participation while in some countries the participate rate is negligible and in some it is average.For example, we can expect people in developed countries to participate more in the equity market compared to low or no participation rates in frontier markets. However my research into this subject led me to conclude that this assumption is not true. Participation rates vary widely even among developed countries. In this post, let me summarize some of the key takeaways from my research into this interesting subject. It should be noted that high quality up to-date data seems to be unavailable on this topic and all the information presented below are the latest I could find from various sources.

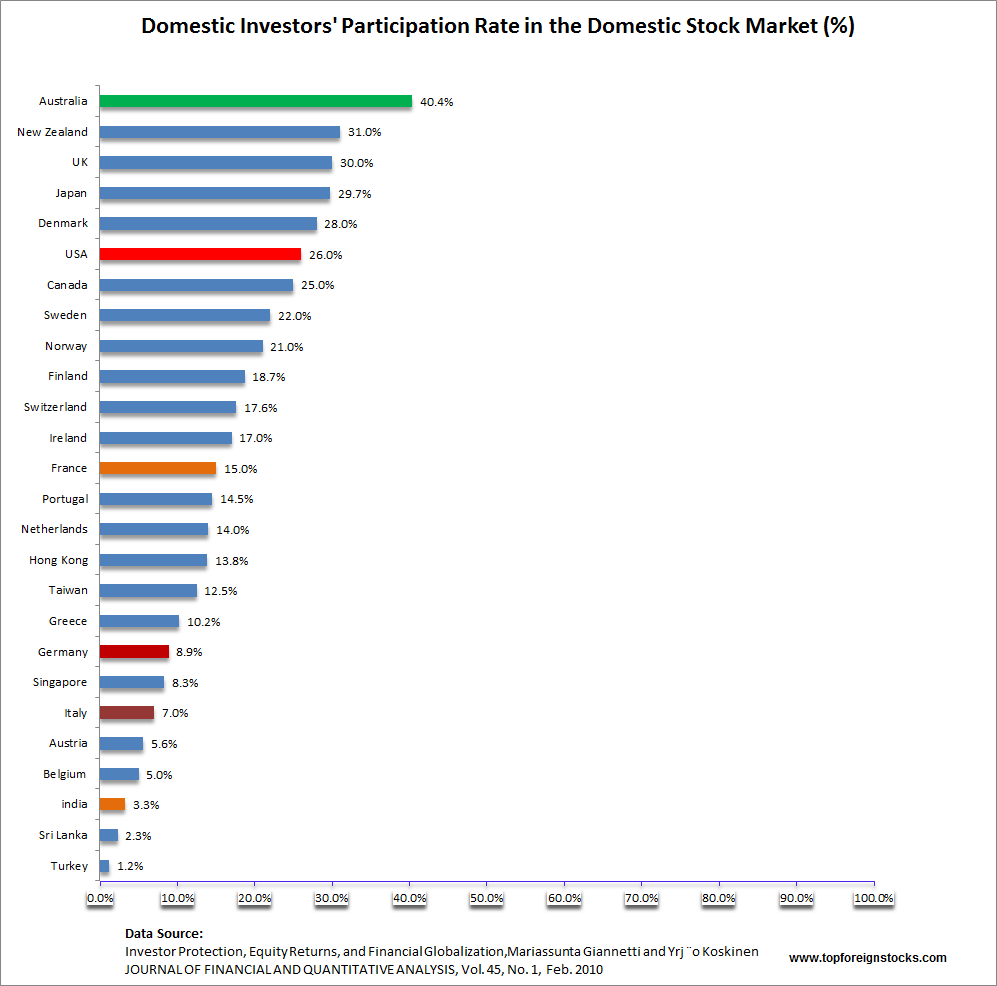
The chart below shows the domestic investors’ participation rates in the local stock market across countries:

Click to enlarge
Stock-Market-Participation-Chart-by-Country-Chart-Best

Source: Investor Protection, Equity Returns, and Financial Globalization,Mariassunta Giannetti and Yrj ¨o Koskinen, JOURNAL OF FINANCIAL AND QUANTITATIVE ANALYSIS, Vol. 45, No. 1, Feb. 2010

Some of the important points to remember related to the domestic investors’ participation rates in the domestic equity market:

  1. Japanese are highly risk averse with households holding only 6% of their total assets in stocks compared with 33% in the U.S. and 15% in Europe according to  the Bank of Japan. Note:These figures differ from the ones shown in the chart above since the sources are different and data are from different periods.
  2. Among the developed countries, Australia has the participation rate at over 40% and Belgium has the lowest rate at 5.0%.
  3. Though Germany is Europe’s largest economy, Germans are also highly conservative and tend to be risk averse. Just under 9% of households invest in stocks as shown int he chart above. An article in BusinessWeek last year noted that Germans are big savers and have a large portion of their household savings in life insurance products.
  4. At 26%, the U.S. has a high participate rate relative to most developed countries.
  5. Emerging countries such as India and Turkey have very low participation rates.
  6. Investors in Nordic countries trust the stock markets more than their European counterparts in countries like France, Germany, Italy, etc.
  7. Rich households always have high participation rates. Poor and middle-class households always have lower participation rates according to one study. (My note: This conclusion is not surprising since the wealthy can always afford to play the stock market and multiply their wealth by hiring competent advisors and hedge fund managers while the poor and middle-class can does not only have low funds to invest but also cannot afford high quality money managers or decent advisors. Government tax policies such as the ones in the U.S. favoring capital gains and dividends over other forms of income also provide a strong incentive for the rich to invest in stocks.)
  8. The data shown in the above chart are for the period from 1997 to 2000 and only represents direct holdings. Indirect holdings via mutual funds and other forms are not included in the figures noted.
  9. Strong investor protection also leads to higher participation rates. Hence developed countries tend to higher participation rates than emerging and frontier countries.
  10. Trust and sociability have sizable impact on stock market participation rates according to another study. Hence high average trust countries such as Denmark, Sweden and Switzerland have higher participation rates than low average trust countries like Austria, Spain and Italy.
  11. Lack of trust in stocks and the risk of being cheated are important factors that explain the limited participation rates in certain countries per a research paper titled “Trusting the Stock Market” by Luigi Guiso, Paola Sapienza and Luigi Zingales in The Journal of Finance in December 2008.
  12. Stock market frauds such as Enron and manipulation of numbers lead investors to question the fundamental trust in the system. Hence trust or the lack thereof explains the big difference in participation rates between countries according to the December 2008 study.

Update:

13. One study found that there is a direct correlation between IQ and market participation. People with higher IQs participate more than those with lower IQ levels.

14. A couple of excellent quotes from the “Trusting the Stock Market” paper:

“The decision to invest in stocks requires not only an assessment of the risk-return trade-off given the
existing data, but also an act of faith (trust) that the data in our possession are reliable and that
the overall system is fair”

” Dyck, Morse, and Zingales (2007), for example, estimate that more than 50% of corporate fraud
goes undetected. This figure is likely to be even higher for other forms of security fraud involving
small investors.”

“After the recent corporate scandals, many politicians and business commentators argued that investors
were deserting the stock market because they had lost their confidence in Corporate America.
In spite of the popularity of this interpretation, the finance literature has thus far ignored the
role of trust in explaining stock market participation and portfolio choices.”

Sources and Related:

  1. Japan’s Fear of Risk Is Getting Dangerous, Bloomberg BusinessWeek
  2. Equity Markets with Controlling Shareholders, Sidharth Sinha, Indian Institute of Management, Ahmedabad
  3. Investor Protection, Equity Returns, and Financial Globalization, Mariassunta Giannetti and Yrj ¨o Koskinen, Journal of Financial and Quantitative Analysis, Vol. 45, No. 1, Feb. 2010
  4. Trust, Sociability and Stock Market Participation Discussion Paper 04/2009 – 015, April 30, 2009, Giacomo PasiniDimitris Georgarakos, Netspar, Network for Studies on Pensions, Aging and Retirement
  5. Trusting the Stock Market by Luigi Guiso, Paola Sapienza and Luigi Zingales, The Journal of Finance, December 2008
  6. IQ and Stock Market Participation by MARK GRINBLATT, MATTI KELOHARJU, and JUHANI LINNAINMAA, THE JOURNAL OF FINANCE • VOL. LXVI, NO. 6 • DECEMBER 2011
  7. THE GEOGRAPHY OF STOCK MARKET PARTICIPATION:THE INFLUENCE OF COMMUNITIES AND LOCAL FIRMS (Federal Reserve)
  8. ‘Only one in thirty people in China owns equities. Just 2% of China’s equities are owned by foreigners’ – Why China’s stock market implosion might not be very meaningful, FT Alphaville, Aug 25, 2015
  9. 5 Reasons Why Brazilians Are Not Investing in Stocks, The Motley Fool, Jan, 2015
  10. The Thrill Is Gone From Owning Stocks, Bloomberg, April 2016
  11. India: What is the share of domestic individuals in equity markets, Live Mint, Mar 2017
  12. Savings and Stocks Make Japanese Households Richer Than Ever, Bloomberg, Mar 16, 2017
  13. On The Stock Market Participation Of Germans, TFS and The Stock Market Participation Rate is Very Low in Germany, TFS
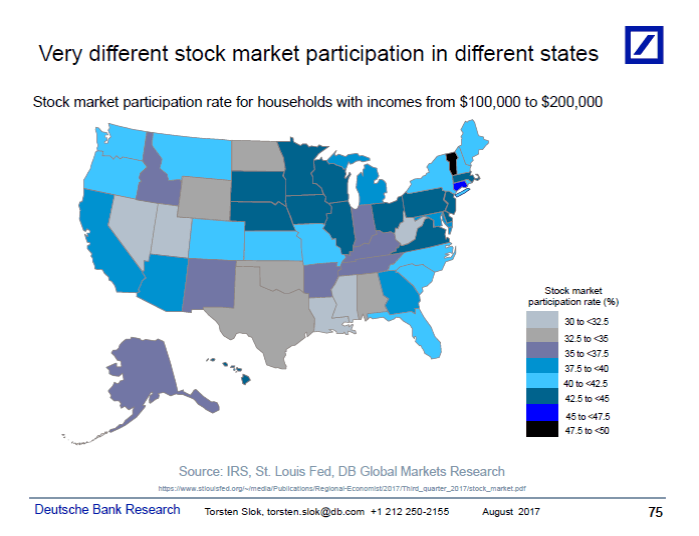
  14. Stock Market Participation in the US by State:

Click to enlarge
Via The Big Picture

15. Financial Literacy and Stock Market Participation, Annamaria Lusardi

16. Household Participation in Stock Market Varies Widely by State, St. Louis Fed

17.The Effects of Trust on Stock Market Participation, Mårten Hagman

18.Participation Matters: Stock Market Participation and the Valuation of National Equity Markets by Matthew D. (Matthew David) Forbes

19. East Germans still invest very less in the stock market, Research Paper at University of California, Berkeley

Updates (12/18/23):

Click to enlarge
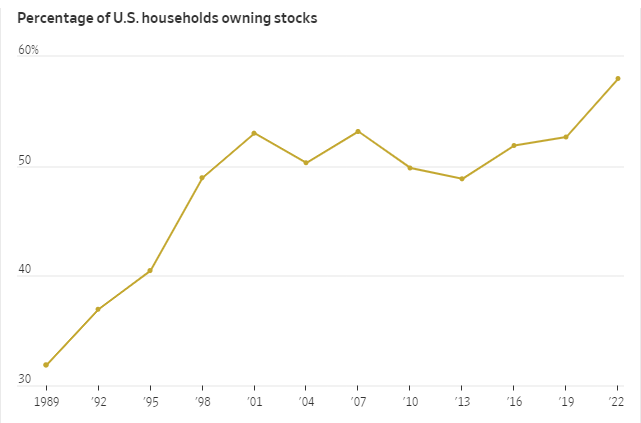
Source: More Americans Than Ever Own Stocks, WSJ

Related posts:
Should You Invest In Japanese Stocks?

Global investors tend to avoid the Japanese stock  despite the country having one of the largest economies in the world. I have also ignored Japan for many years now. However in recent months I have been looking more deeply into the Japanese equity market for potential investment opportunities.

From the Ahead of the Tape column in The Wall Street Journal earlier this month:

Every so often, investors look at the yawning gap between the performance of Japanese stocks and nearly any other market and take the bait. Many are doing so again in 2013.

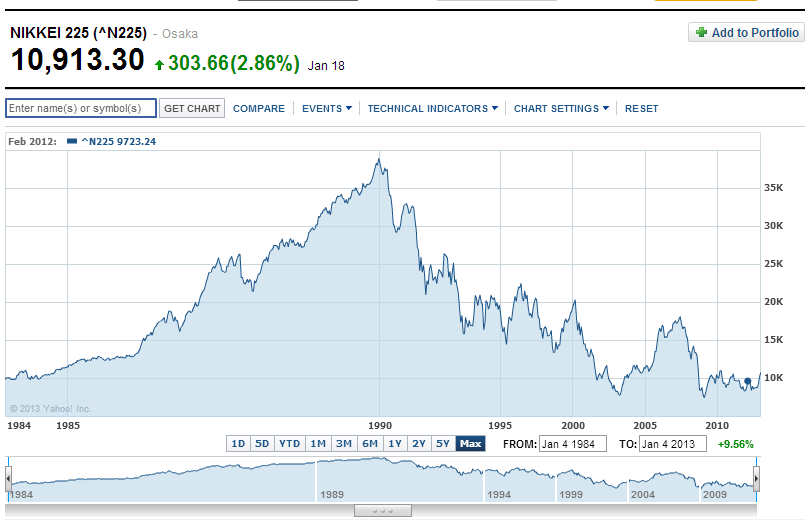
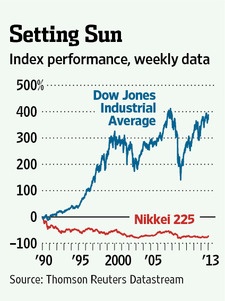
Japan certainly looks tempting, with its benchmark Nikkei 225 stock index having gone from a level of more than 14 times the Dow Jones Industrial Average at its late-1989 peak to eight-tenths of the Dow’s level today.

Click to enlarge

Nikkei-vs-Dow-Jones

Source: The Wall Street Journal

The article noted the many false dawns for the Nikkei including “a 34% rally beginning in 1990, a 50% one starting in 1992, a 55% one in 1995, a 62% one in 1998 and a 140% run from 2003 to 2007.”

The long-term chart of the Nikkei Index is shown below:

Nikkei-225-Long-Term-Chart

Source: Yahoo Finance

The Economist magazine published an interesting article in 2011 on the positive side of Japan’s economy. From the article titled “Whose lost decade?“:

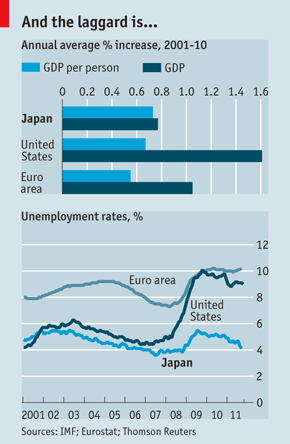
In aggregate, Japan’s economy grew at half the pace of America’s between 2001 and 2010. Yet if judged by growth in GDP per person over the same period, then Japan has outperformed America and the euro zone (see chart 1). In part this is because its population has shrunk whereas America’s population has increased.

Though growth in labour productivity fell slightly short of America’s from 2000 to 2008, total factor productivity, a measure of how a country uses capital and labour, grew faster, according to the Tokyo-based Asian Productivity Organisation. Japan’s unemployment rate is higher than in 2000, yet it remains about half the level of America and Europe (see chart 2).

Japan-Chart

Besides supposed stagnation, the two other curses of the Japanese economy are debt and deflation. Yet these also partly reflect demography and can be overstated. People often think of Japan as an indebted country. In fact, it is the world’s biggest creditor nation, boasting ¥253 trillion ($3.3 trillion) in net foreign assets.

To be sure, its government is a large debtor; its net debt as a share of GDP is one of the highest in the OECD. However, the public debt has been accrued not primarily through wasteful spending or “bridges to nowhere”, but because of ageing, says the IMF. Social-security expenditure doubled as a share of GDP between 1990 and 2010 to pay rising pensions and health-care costs. Over the same period tax revenues have shrunk.

Source: Japan’s economy – Whose lost decade?, The Economist

Ever since the collapse in the Nikkei since its 1989 peak, the Japanese have become wary of not just the stock market but taking risks in general. According to an article in Bloomberg BusinessWeek in December last year, the Japanese hold only 6% of household assets in stocks compared with 33% in the U.S. and 15% in Europe. The low stock market participation rate is striking since Japan has the lowest taxes on dividends among developed countries and only 10% taxes on capital gains. From the BusinessWeek piece:

Kayoko Okamoto knocked on 100 doors a day trying to persuade residents in some of Tokyo’s most well-to-do neighborhoods to sign up for free brokerage accounts. The former saleswoman for Aizawa Securities says she was lucky if she found 10 people a month willing to take a chance. With the Nikkei stock average down 76 percent from its 1989 peak and 1.5 quadrillion yen ($18 trillion) in wealth erased when an asset bubble burst, a generation of Japanese investors has grown up convinced that stocks only go down. “My job was putting up with rejection,” says Okamoto. “Most people have no tolerance for risk.”

The stock market isn’t the only place where the Japanese don’t like to take chances. The country suffers from a play-it-safe mentality that’s become ever-present in daily life, according to Harvard University sociologist Mary Brinton. “There’s a tendency to focus more on potential downsides rather than on opportunities,” says Brinton, co-author of A Japan That Turns Its Back on Risk, a book published in 2010. That may explain why regulators held up vaccines approved decades earlier in other countries, why few Japanese students choose to study abroad, and why 844 trillion yen, almost twice the country’s yearly economic output, sits idle in cash at home and in savings accounts earning 0.02 percent.

Source: Japan’s Fear of Risk Is Getting Dangerous,  Bloomberg BusinessWeek

It should be noted that foreigners are some of the major investors in Japanese stocks. Investors looking to invest in Japan have to be extremely selective. Investors can avoid the electronics and the banking sector. Auto parts manufacturing, chemicals manufacturing, industrial engineering, telecommunications are some of the industries that look attractive from an investment point of view. For investors willing to make a bet on Japanese stocks, here are ten stocks to consider:

1.Company: Toyota Motor Corp (TM)
Current Dividend Yield: 1.55%
Sector: Auto & Truck Manufacturers

2.Company: Honda Motor Co Ltd (HMC)
Current Dividend Yield: 2.19%
Sector: Auto & Truck Manufacturers

3.Company: Nippon Telegraph and Telephone Corp (NTT)
Current Dividend Yield: 4.37%
Sector: Telecom

4.Company: Kyocera Corp (KYO)
Current Dividend Yield: 0.78%
Sector: Electronic Instrmentation & Controls

5.Company: Makita Corp (MKTAY)
Current Dividend Yield: 1.90%
Sector: Capital Goods

6.Company: Bridgestone Corp (BRDCY)
Current Dividend Yield: 1.30%
Sector: Tires

7.Company: Denso Corp (DNZOY)
Current Dividend Yield: 1.64%
Sector: Auto parts

8.Company: East Japan Railway Co (EJPRY)
Current Dividend Yield: 2.18%
Sector: Railway transportation

9.Company: Sumitomo Chemical Co Ltd (SOMMY)
Current Dividend Yield: 3.86%
Sector: Chemicals

10.Company: Nitto Denko Corp (NDEKY)
Current Dividend Yield: 3.39%
Sector: Chemicals

Note: Dividend yields noted are as of Jan 18, 2013

Another simple way to invest in Japan is via the iShares  Japan ETF (EWJ). Currently the fund has total assets of about $5.0 B and a dividend yield of 1.92%.

Disclosure: No Positions

Related:

Ignore the sceptics – it’s time to buy Japan (MoneyWeek, Feb 12, 2013)

Amid Japan’s Stock Rally, the Individual Investor Returns (Bloomberg BusinessWeek, Feb 14, 2013)

Why Japanese Stocks Could Rally 60%: Strategist (CNBC, Mar 1, 2013)

Japan’s Stock Bulls Need a Rest (Barron’s , Jan 22, 2013)

For a list of all Japanese ADRs go here.

Doubleline’s Jeffrey Gundlach on March 12, 2013 (Advisor Perspectives):

Gundlach said it’s likely the Nikkei will be up 20% in dollar terms this year.

“Japanese stocks are cheaper than U.S. stocks,” Gundlach said. “If I was forced to own one stock market, it would be the Japanese stock market.”

To read his take on Japanese stocks click here (Page 4)

Japan: this time it’s different (MoneyWeek, Mar 18, 2013)

Buy the Regionals and Ignore Super Banks

Regional banks have recovered strongly and are performing much better than the four banks. According to a recent article in the journal regionals are increasing lending and accordingly earnings are growing rapidly. The 4th quarter 2012 earnings reported so far by some of these banks are cheering investors who are bidding up the stocks prices. From the WSJ article:

Adding to the toxic brew for some larger banks is public disaffection with giant firms that are perceived as slow and unresponsive and, in some cases, as having benefited disproportionately from government bailouts in 2008 and 2009 without offering commensurate benefits to the public.

The business model in use at Bank of America and Citigroup is “too big to profit, not just too big to fail,” said Joshua Siegel, chief executive of StoneCastle Partners LLC, a New York firm that invests in banks. Revenue declined in 2012 for the third consecutive year at Bank of America and for the second year in a row at Citigroup. Revenue at the two companies has declined $50 billion, or 24%, from its peak.

In the past year, in contrast, revenue rose 12% at BB&T, 10% at Fifth Third and 8% at PNC.

The future looks promising for smaller banks as the economic recovery takes hold. Investors looking to gain exposure to the US banking sector are better off going with the regionals and community banks as opposed to the large banks.

Five of the regional banks and their current dividend yields are noted below:

1.Company: Fifth Third Bancorp (FITB)
Current Dividend Yield: 2.44%

2. Company: PNC Financial Services Group Inc (PNC)
Current Dividend Yield: 2.59%

3.Company: U.S. Bancorp (USB)
Current Dividend Yield: 2.37%

4.Company:BB&T Corp (BBT)
Current Dividend Yield: 2.58%

5.Company: State Street Corp (STT)
Current Dividend Yield: 1.80%

Note: Dividend yields noted are as of Jan 17, 2013

Disclosure:  Long USB, PNC, BBT and FITB

Knowledge is Power: Snakes and Ladders, European Equities, America Edition

Snakes and Ladders: Investment Banking on the Brink (Der Spiegel)

Olive: The car rules once more  (The Star)

How to Invest in Bank Stocks via ETFs? (Top US Stocks)

Programmer Bob who outsourced his job was a model modern employee  (The Guardian)

INVESTMENT EXTRA: How you could bag a stylish return by investing in small firms (This is Money)

Canada’s Dutch Disease diagnosis flawed, study says (Financial Post)

Ladies and gentlemen, the U.S. housing market really is back (Macleans)

Strengthening Euro Area banks (OECD)

European funds set for “15 per cent return” in 2013  (Trustnet)

Faber: I’m still holding onto European equities (CityWire, UK)

Country risk: The safest and riskiest European banking sectors (Euromoney)

America on the rebound (Canadian Business)

2013 Outlook: Less risk, less reward (The Asset)

Kuala-Lumpur-Malaysia

Kuala Lumpur, Malaysia