Global investors tend to avoid the Japanese stock despite the country having one of the largest economies in the world. I have also ignored Japan for many years now. However in recent months I have been looking more deeply into the Japanese equity market for potential investment opportunities.
From the Ahead of the Tape column in The Wall Street Journal earlier this month:
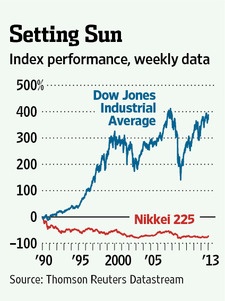
Every so often, investors look at the yawning gap between the performance of Japanese stocks and nearly any other market and take the bait. Many are doing so again in 2013.
Japan certainly looks tempting, with its benchmark Nikkei 225 stock index having gone from a level of more than 14 times the Dow Jones Industrial Average at its late-1989 peak to eight-tenths of the Dow’s level today.
Click to enlarge
Source: The Wall Street Journal
The article noted the many false dawns for the Nikkei including “a 34% rally beginning in 1990, a 50% one starting in 1992, a 55% one in 1995, a 62% one in 1998 and a 140% run from 2003 to 2007.”
The long-term chart of the Nikkei Index is shown below:
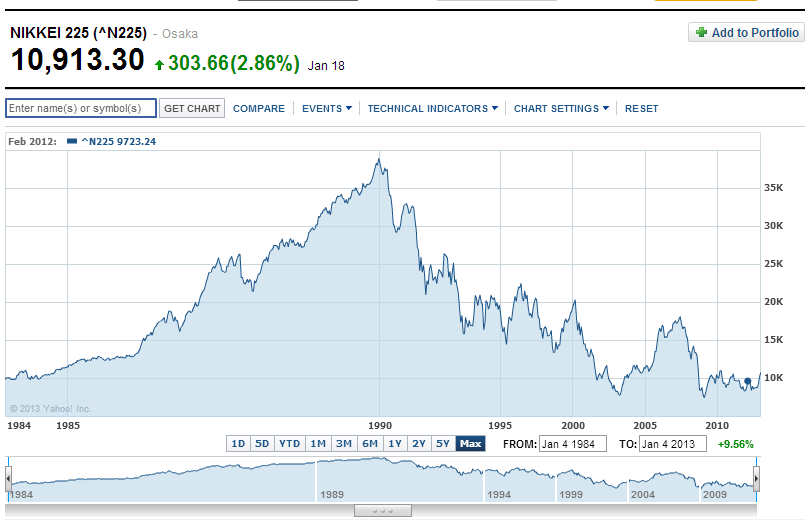
Source: Yahoo Finance
The Economist magazine published an interesting article in 2011 on the positive side of Japan’s economy. From the article titled “Whose lost decade?“:
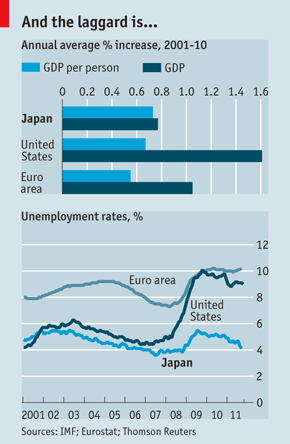
In aggregate, Japan’s economy grew at half the pace of America’s between 2001 and 2010. Yet if judged by growth in GDP per person over the same period, then Japan has outperformed America and the euro zone (see chart 1). In part this is because its population has shrunk whereas America’s population has increased.
Though growth in labour productivity fell slightly short of America’s from 2000 to 2008, total factor productivity, a measure of how a country uses capital and labour, grew faster, according to the Tokyo-based Asian Productivity Organisation. Japan’s unemployment rate is higher than in 2000, yet it remains about half the level of America and Europe (see chart 2).
Besides supposed stagnation, the two other curses of the Japanese economy are debt and deflation. Yet these also partly reflect demography and can be overstated. People often think of Japan as an indebted country. In fact, it is the world’s biggest creditor nation, boasting ¥253 trillion ($3.3 trillion) in net foreign assets.
To be sure, its government is a large debtor; its net debt as a share of GDP is one of the highest in the OECD. However, the public debt has been accrued not primarily through wasteful spending or “bridges to nowhere”, but because of ageing, says the IMF. Social-security expenditure doubled as a share of GDP between 1990 and 2010 to pay rising pensions and health-care costs. Over the same period tax revenues have shrunk.
Source: Japan’s economy – Whose lost decade?, The Economist
Ever since the collapse in the Nikkei since its 1989 peak, the Japanese have become wary of not just the stock market but taking risks in general. According to an article in Bloomberg BusinessWeek in December last year, the Japanese hold only 6% of household assets in stocks compared with 33% in the U.S. and 15% in Europe. The low stock market participation rate is striking since Japan has the lowest taxes on dividends among developed countries and only 10% taxes on capital gains. From the BusinessWeek piece:
Kayoko Okamoto knocked on 100 doors a day trying to persuade residents in some of Tokyo’s most well-to-do neighborhoods to sign up for free brokerage accounts. The former saleswoman for Aizawa Securities says she was lucky if she found 10 people a month willing to take a chance. With the Nikkei stock average down 76 percent from its 1989 peak and 1.5 quadrillion yen ($18 trillion) in wealth erased when an asset bubble burst, a generation of Japanese investors has grown up convinced that stocks only go down. “My job was putting up with rejection,” says Okamoto. “Most people have no tolerance for risk.”
The stock market isn’t the only place where the Japanese don’t like to take chances. The country suffers from a play-it-safe mentality that’s become ever-present in daily life, according to Harvard University sociologist Mary Brinton. “There’s a tendency to focus more on potential downsides rather than on opportunities,” says Brinton, co-author of A Japan That Turns Its Back on Risk, a book published in 2010. That may explain why regulators held up vaccines approved decades earlier in other countries, why few Japanese students choose to study abroad, and why 844 trillion yen, almost twice the country’s yearly economic output, sits idle in cash at home and in savings accounts earning 0.02 percent.
Source: Japan’s Fear of Risk Is Getting Dangerous, Bloomberg BusinessWeek
It should be noted that foreigners are some of the major investors in Japanese stocks. Investors looking to invest in Japan have to be extremely selective. Investors can avoid the electronics and the banking sector. Auto parts manufacturing, chemicals manufacturing, industrial engineering, telecommunications are some of the industries that look attractive from an investment point of view. For investors willing to make a bet on Japanese stocks, here are ten stocks to consider:
1.Company: Toyota Motor Corp (TM)
Current Dividend Yield: 1.55%
Sector: Auto & Truck Manufacturers
2.Company: Honda Motor Co Ltd (HMC)
Current Dividend Yield: 2.19%
Sector: Auto & Truck Manufacturers
3.Company: Nippon Telegraph and Telephone Corp (NTT)
Current Dividend Yield: 4.37%
Sector: Telecom
4.Company: Kyocera Corp (KYO)
Current Dividend Yield: 0.78%
Sector: Electronic Instrmentation & Controls
5.Company: Makita Corp (MKTAY)
Current Dividend Yield: 1.90%
Sector: Capital Goods
6.Company: Bridgestone Corp (BRDCY)
Current Dividend Yield: 1.30%
Sector: Tires
7.Company: Denso Corp (DNZOY)
Current Dividend Yield: 1.64%
Sector: Auto parts
8.Company: East Japan Railway Co (EJPRY)
Current Dividend Yield: 2.18%
Sector: Railway transportation
9.Company: Sumitomo Chemical Co Ltd (SOMMY)
Current Dividend Yield: 3.86%
Sector: Chemicals
10.Company: Nitto Denko Corp (NDEKY)
Current Dividend Yield: 3.39%
Sector: Chemicals
Note: Dividend yields noted are as of Jan 18, 2013
Another simple way to invest in Japan is via the iShares Japan ETF (EWJ). Currently the fund has total assets of about $5.0 B and a dividend yield of 1.92%.
Disclosure: No Positions
Related:
Ignore the sceptics – it’s time to buy Japan (MoneyWeek, Feb 12, 2013)
Amid Japan’s Stock Rally, the Individual Investor Returns (Bloomberg BusinessWeek, Feb 14, 2013)
Why Japanese Stocks Could Rally 60%: Strategist (CNBC, Mar 1, 2013)
Japan’s Stock Bulls Need a Rest (Barron’s , Jan 22, 2013)
For a list of all Japanese ADRs go here.
Doubleline’s Jeffrey Gundlach on March 12, 2013 (Advisor Perspectives):
Gundlach said it’s likely the Nikkei will be up 20% in dollar terms this year.
“Japanese stocks are cheaper than U.S. stocks,” Gundlach said. “If I was forced to own one stock market, it would be the Japanese stock market.”
To read his take on Japanese stocks click here (Page 4)
Japan: this time it’s different (MoneyWeek, Mar 18, 2013)