During the 1800s the U.S. was an emerging market. During that time the Tsars ruled Russia and Russian equities trading on the St.Petersburg Stock Exchange performed better than U.S. equities on the New York Stock Exchange.
Click to enlarge
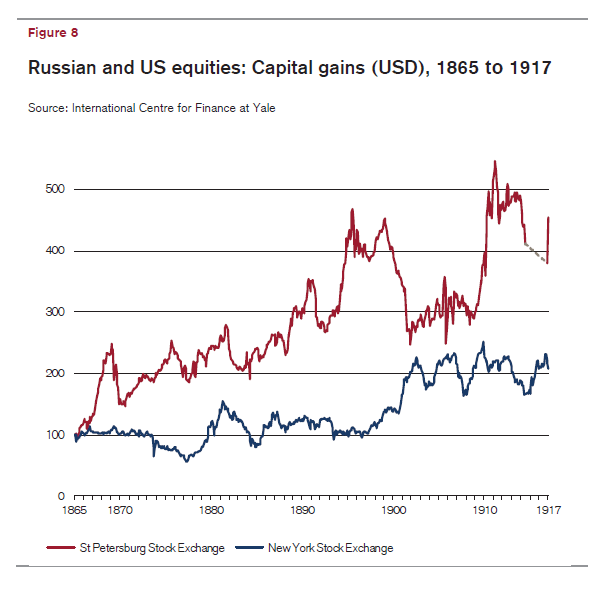
The above chart shows that Russian stocks vastly outperformed U.S. stocks from 1865 thru 1917. However a couple of fascinating points have to taken into account when reviewing the Russian stocks towards the early 1900s. From July 1914 the St. Petersburg Exchange was shut down due to World War I as denoted by the dotted gray line in the chart above. Then when the market opened in 1917 stocks rallied swiftly by about 20%. But the euphoria was short-lived as the Russian Revolution came along almost immediately. By October of 1917 the Tsarist government was overthrown and communists too control of the country. As a result of the revolution all Tsarist era securities became worthless.
So even though Russian stocks were great to hold from mid 1800s to early 1900s, all of a sudden they all became worthless . The key takeaway from this story is markets can turn upside down without warning due to political upheavals Hence investors investing abroad have to monitor political developments in addition to company’s financials and macro-economic changes.
Source: Credit Suisse Global Investment Yearbook 2013, Credit Suisse
Hat Tip: The Big Picture
Here is the more recent long-term performance of Russia’s RTS Index vs S&P 500:
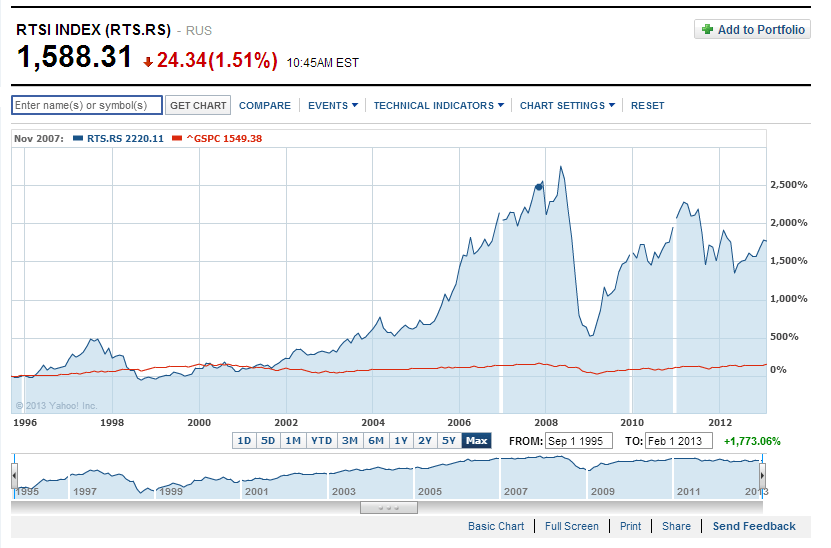
Source: Yahoo Finance
Related ETFs:
SPDR S&P 500 ETF (SPY)
Market Vectors® Russia ETF (RSX)
Disclosure: No Positions
 Investors looking to add stocks for the long-term (5 years or more) can consider companies in the utility, telecom and other sectors that generally have high dividend yields. These sectors pay dividends of more than 4% – which is double of the yield on the S&P 500 index.