One of the simplest and easiest ways to reduce risk with investing in equity markets is via diversification. Instead of putting all eggs in one basket it is wise to spread the assets in a portfolio across many asset classes, types, regions, countries, sectors, etc. The following chart shows the total return of key indices from 2012 to 2021:
Click to enlarge
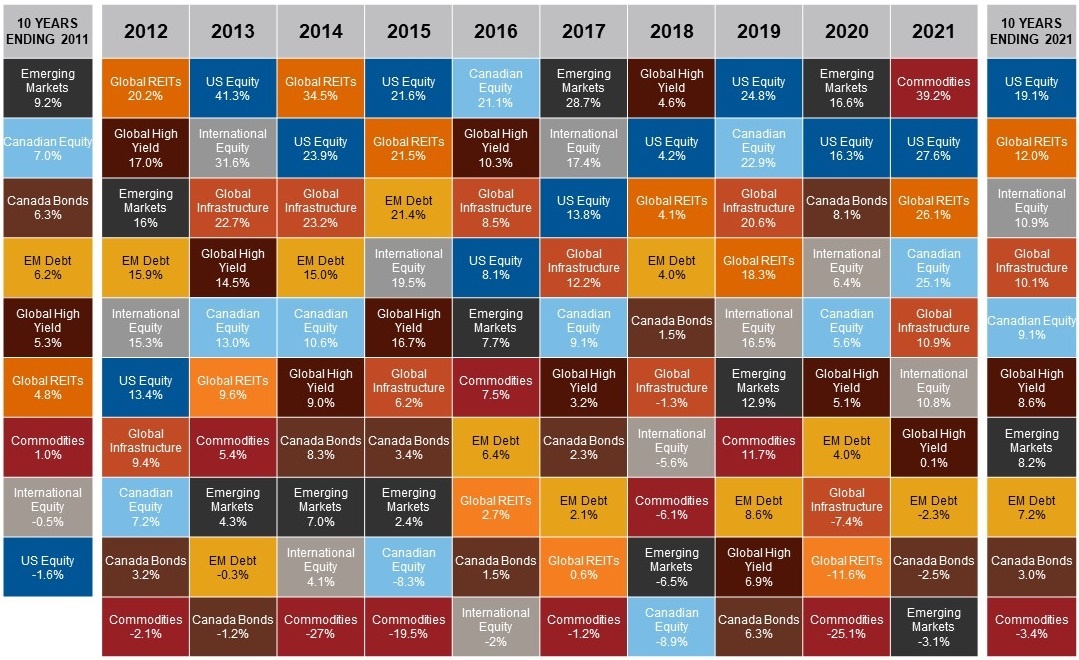
Source: Morningstar Direct, Russell Investments. Annualized return in CAD. Canadian equity=S&P/TSX Composite Index, US Equity=S&P 500 Index, International Equity=MSCI EAFE Index, Emerging Markets=MSCI Emerging Markets Index, Canada Bonds=S&P Canada Aggregate Bond Index, Emerging Markets Debt= JP Morgan Emerging Market Bond Index, Global High Yield=Bloomberg Global High Yield Index, Global Infrastructure=S&P Global Infrastructure Index, Global Real Estate Investment Trusts (REITs)=FTSE EPRA NAREIT Developed REITS Index, Commodities= S&P Goldman Sachs Commodities Index, Indexes are unmanaged and cannot be invested in directly. Past performance is not indicative of future results. Index performance does not include fees and expenses an investor would normally incur when investing in a mutual fund. Diversification and strategic asset allocation do not assure profit or protect against loss in declining markets.
Note: The returns noted are in Canadian dollars
Source: Going Global: Finding Opportunities in a World of Uncertainty, Russell Investments


